
Top 7 Virtualization Monitoring Dashboards
Virtualization monitoring dashboards keep your virtual systems running smoothly by tracking performance, optimizing resources, and alerting you to issues. Here’s a quick look at the top 7 dashboards for 2025:
- Commvault: Predicts storage needs, integrates with AWS, and ensures compliance with HIPAA and SOX.
- Entuity: Tracks hybrid environments with detailed metrics and refreshes every 30 seconds.
- ManageEngine OpManager: Offers VM sprawl management and root cause analysis for faster troubleshooting.
- NetApp VM Monitor: Links VM performance with storage insights and supports long-term trend analysis.
- SolarWinds: Uses AI for predictive analytics and optimizes underutilized resources.
- Grafana for Red Hat: Provides real-time insights and long-term data retention for up to 5 years.
- eG Enterprise: Combines infrastructure and application monitoring with advanced root cause diagnostics.
Quick Comparison
| Dashboard | Best For | Key Features | Integration | Cost |
|---|---|---|---|---|
| Commvault | Multi-tenant environments | Predictive analytics, ransomware detection | AWS, ServiceNow, Splunk | Custom pricing |
| Entuity | Hybrid virtualization | 4-dashlet system, fast refresh rates | ServiceNow, Teams, Splunk | $150/node annually |
| ManageEngine OpManager | Resource optimization | VM sprawl management, RCA engine | ServiceNow, Slack | Custom pricing |
| NetApp VM Monitor | Storage-focused monitoring | Real-time storage metrics, long-term trends | VMware vCenter, Azure | Custom pricing |
| SolarWinds | Large-scale environments | Predictive analytics, resource optimization | VMware, AWS, Hyper-V | Custom pricing |
| Grafana for Red Hat | Long-term trend analysis | Data retention, storage management precision | Red Hat Virtualization (RHV) | Custom pricing |
| eG Enterprise | Application-centric monitoring | AI-powered diagnostics, security compliance | AD/LDAP, HIPAA, PCI DSS | Custom pricing |
These tools are essential for maintaining uptime, optimizing resources, and streamlining operations in virtualized environments.
End-to-End Virtualization Management and Performance Monitoring
1. Commvault Virtualization Dashboard
The Commvault Virtualization Dashboard simplifies monitoring for VMware vSphere, Microsoft Hyper-V, and Nutanix AHV, bringing everything into one place for easier management.
One standout feature is its predictive analytics, which forecasts capacity needs and alerts you to potential storage shortages up to 30 days in advance.
Key Metrics
| Metric | Threshold | Action Trigger |
|---|---|---|
| VM Disk I/O | 20ms | Critical Alert |
| CPU Utilization | 90% | Resource Warning |
| Backup Success | 95% | Storage Tiering |
| VM Protection | 85% | Compliance Alert |
The dashboard also includes strong security measures like FIPS 140-2 encryption and detailed audit trails, ensuring compliance with HIPAA and SOX standards. Its ransomware detection system is highly accurate, identifying encrypted files with 99.9% precision to safeguard virtual environments.
For example, a Midwest hospital used the dashboard’s predictive alerts during the Q1 2025 vaccine rollout. This helped them achieve 99.99% uptime and cut VM downtime by 73%.
Automation Features
Automation tools save time by handling tasks such as:
- Auto-scaling storage during high-demand periods
- Scheduling backups during off-hours
- Triggering instant VM replication based on performance metrics
The dashboard also integrates seamlessly with AWS EC2, ServiceNow, and Splunk, making workflows smoother and more efficient.
Finally, it offers a range of training resources to help teams get started and manage the system effectively over time.
2. Entuity Virtualization Dashboard
Entuity’s dashboard provides a clear view of hybrid virtualization environments with its four-dashlet system, tracking over 50 key metrics such as latency and resource usage. Here’s a breakdown of its main components:
Core Components
| Dashlet | Purpose | Key Metrics |
|---|---|---|
| VMs by Platform | Shows distribution trends | Platform allocation, usage trends |
| VM Status over Time | Tracks performance | Uptime, resource consumption |
| Virtualization Platforms | Manages hypervisors | Host status, cluster health |
| Virtual Machines | Provides detailed metrics | Memory, storage, snapshots |
The dashboard’s hierarchical navigation allows IT teams to move seamlessly from platform-level metrics to individual virtual machines, simplifying troubleshooting.
Advanced Monitoring Features
With an API-first approach, the system refreshes every 30 seconds, delivering faster insights compared to standard 5-minute SNMP cycles. For example, during a 43% latency spike, admins quickly identified a Windows Server VM with 14 snapshots causing I/O bottlenecks. After consolidating the snapshots, performance stabilized in just 15 minutes.
Enterprise Integration
The platform integrates with tools like ServiceNow, Splunk, Microsoft Teams, and custom APIs, enabling incident management, log analysis, and real-time alerts.
Customization Options
Entuity offers over 100 prebuilt dashlets tailored for specific roles. Its device-based licensing costs $150 per node annually. The system also detects hardware issues automatically – HPE iLO users, for instance, have pinpointed faulty DIMM modules using hardware status dashlets.
3. ManageEngine OpManager Virtual System Monitor
ManageEngine OpManager provides comprehensive monitoring for VMware ESX/ESXi, Hyper‑V, Citrix Xen, and Nutanix environments. Its integrated dashboard can map host-VM relationships in just 15 minutes. Here’s a closer look at its key features:
Core Performance Tracking
The dashboard tracks critical virtualization metrics using specialized widgets:
| Metric Category | Monitored Parameters | Alert Thresholds |
|---|---|---|
| CPU Performance | Wait/Ready states, CPU utilization | Over 20% Ready Time (5 min) |
| Memory Management | Balloon, Shared, Swapped | Over 90% allocation |
| Storage | I/O latency, Throughput | Custom thresholds per datastore |
| Network | Packet loss, Bandwidth | User-defined limits |
Resource Optimization Tools
OpManager’s VM sprawl management dashboard helps reclaim an average of 23% of wasted resources. It automatically identifies:
- Over-provisioned VMs using more than 90% of allocated resources.
- Under-utilized instances operating at less than 10% usage for seven consecutive days.
- Idle VMs with less than 5% CPU or memory usage over 30 days.
Advanced Monitoring Features
The platform includes a Root Cause Analysis (RCA) engine that links storage performance to VM behavior, making troubleshooting faster and more efficient. This approach has reduced problem resolution time by 40% in environments with more than 500 VMs. Additionally, proactive, threshold-based alerts help maintain an impressive 99.95% VM availability.
Enterprise Integration
Beyond performance monitoring, OpManager integrates seamlessly with enterprise tools to improve workflows. Key features include:
- Automated VM migration when resources are under strain.
- Workflow-triggered issue resolution.
- Direct integrations with platforms like ServiceNow and Slack.
- Customizable compliance reporting.
Its agentless architecture supports over 39,000 device types using preconfigured templates. Plus, forecasting tools powered by linear regression help prevent 78% of capacity-related issues before they affect operations.
4. NetApp VM Monitor Dashboard
NetApp’s VM monitoring tool offers a comprehensive way to connect VM performance with storage metrics, making it easier to track and manage virtualization performance.
Performance Tracking Features
The dashboard provides detailed insights into VM performance using specialized widgets that monitor key metrics:
| Metric Type | Parameters Monitored | Update Frequency |
|---|---|---|
| Storage I/O | Read/Write IOPS, Throughput (MB/s) | Real-time |
| Latency | VM and VMDK latency metrics | Every 5 minutes |
| Capacity | Committed capacity, Space usage | Hourly |
| Resource Usage | CPU, Memory, Network | Real-time |
Advanced Visualization Tools
The system includes interactive visuals to help administrators quickly spot performance issues. Customizable widgets allow users to create views tailored to specific operational needs, while automatic metric roll-up simplifies data handling. For environments with over 5,000 VMs, NetApp suggests using its Data Infrastructure Insights platform to handle distributed monitoring more effectively.
Enterprise Integration Features
NetApp integrates seamlessly with VMware’s vCenter Server via Virtual Storage Console (VSC), offering:
- Automated collection of performance data
- Real-time mapping of storage topology
- Threshold-based alerts using Storage I/O Control
- Role-based access for secure management
Historical Analysis Capabilities
The dashboard doesn’t just focus on real-time data – it also supports long-term planning. By retaining detailed performance metrics, it enables trend analysis to identify patterns like seasonal usage spikes. For example, a 2022 VMware implementation showed that organizations using NetApp’s Storage Topology Dashboard resolved VM performance issues 40% faster when tracing problems to specific LUNs.
"Native ONTAP integration delivers exclusive volume space-saving insights."
Security and Scalability
For multi-tenant setups, the dashboard uses vCenter Server’s role-based access controls and ensures secure communication with TLS 1.2 encryption. The platform is designed to scale efficiently with features like server-side pagination, dynamic filtering, and automatic metric aggregation. It also supports cloud monitoring through NetApp Cloud Volumes ONTAP, though deploying on Azure requires additional configuration.
5. SolarWinds VM Dashboard
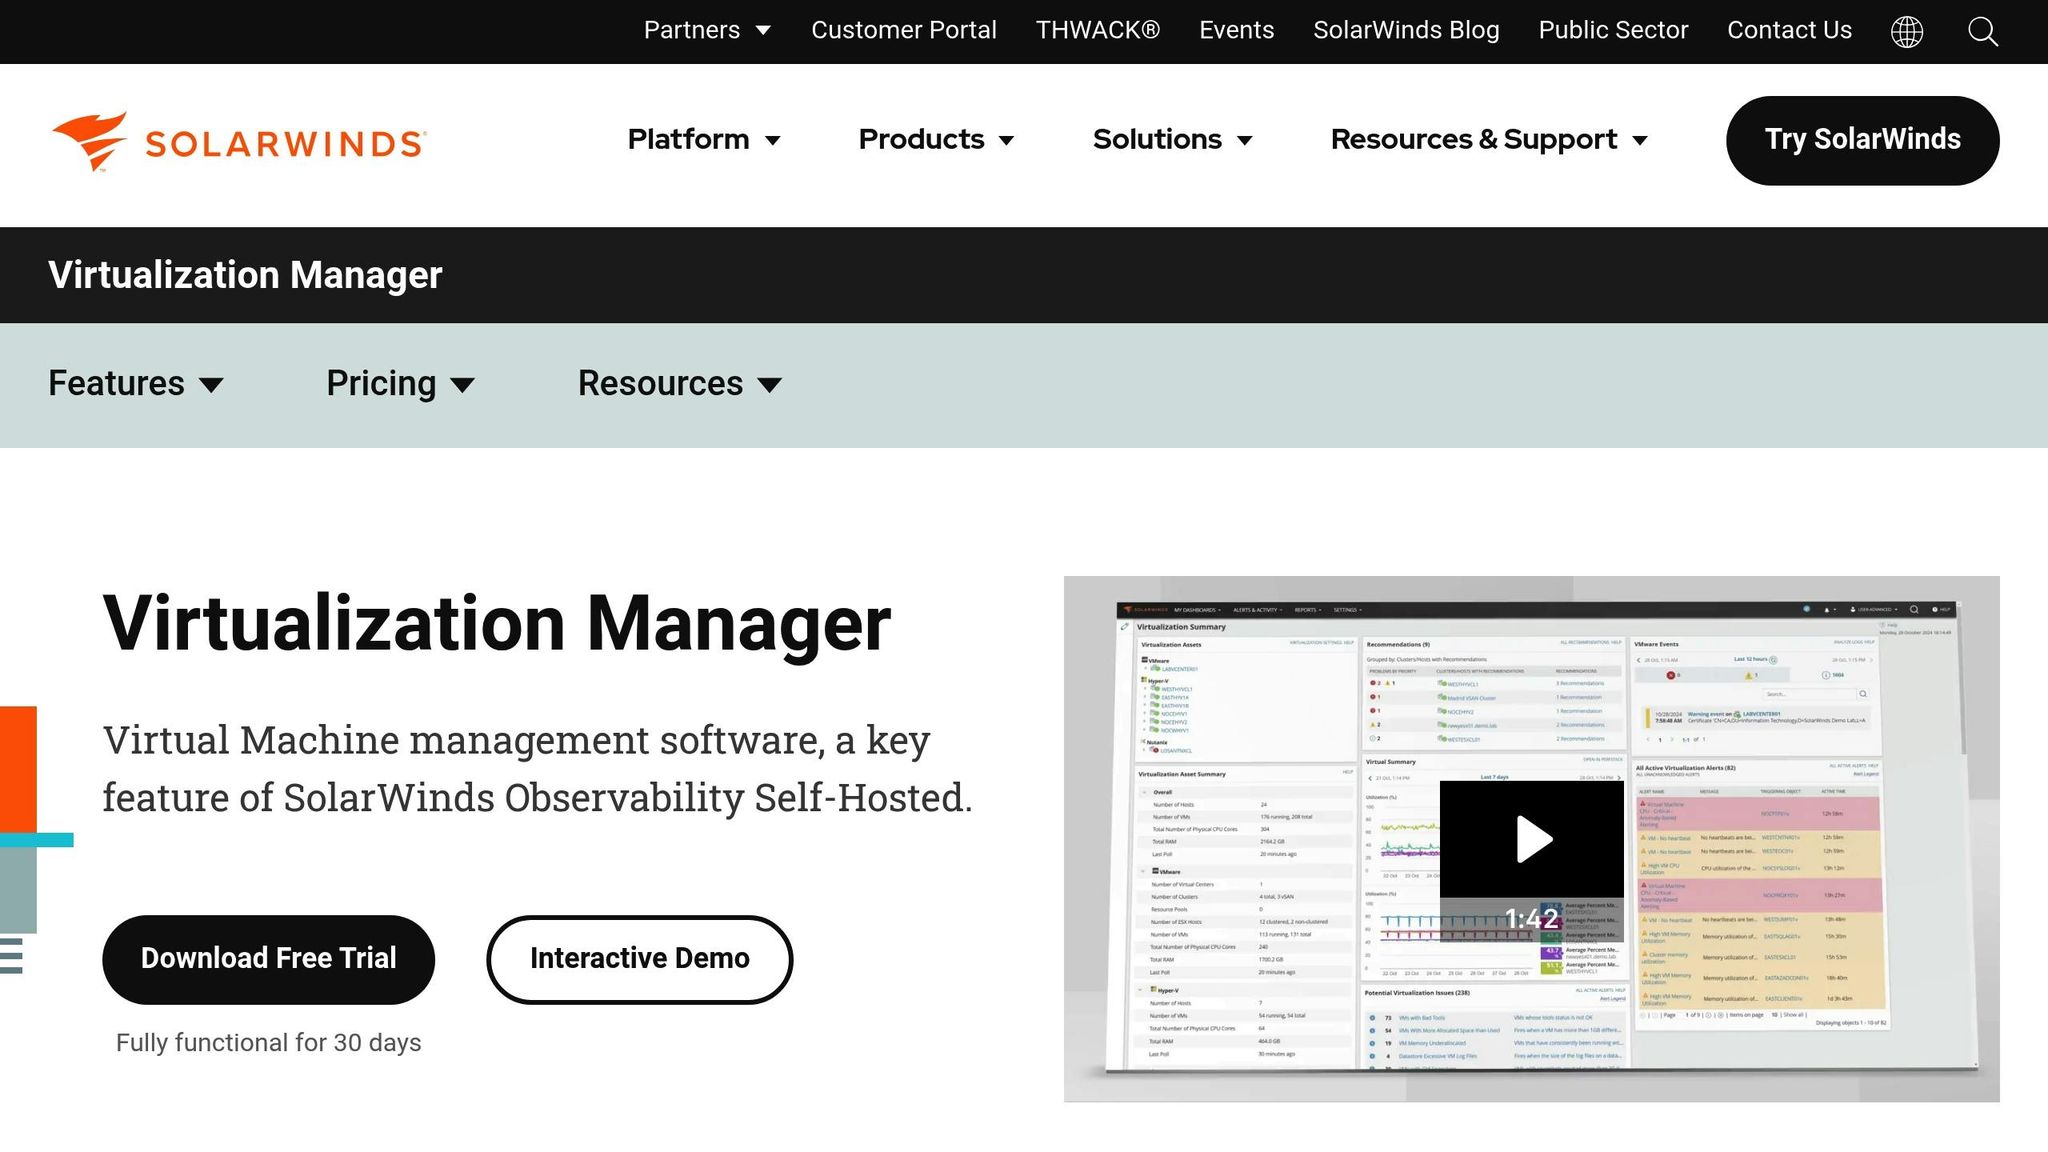
SolarWinds provides a virtualization dashboard designed to handle complex environments. It consolidates performance monitoring across platforms, delivering detailed metrics through an easy-to-navigate web console.
Real-Time Monitoring
This dashboard tracks key virtualization metrics, broken down into categories:
| Metric Category | Parameters |
|---|---|
| Performance | CPU ready time, Memory usage |
| Storage | Disk I/O latency |
| Network | Network throughput |
| Hardware | Fan/PSU status |
Predictive Analytics for Better Performance
Using a machine learning engine, the platform analyzes trends over 30 days to offer actionable recommendations. For example, a SolarWinds technical architect (May 2024) reported that the predictive analytics feature reduced CPU ready time from 12% to 3% within 72 hours and freed up 1.2TB of storage.
Advanced Alerts
The alert system uses threshold monitoring with context-aware triggers, such as:
- Datastore latency above 20ms for over 5 minutes
- Memory ballooning exceeding 15% of allocated resources
- Hardware anomalies signaling potential failures
These alerts work alongside capacity planning tools to ensure smooth operation.
Capacity Planning Made Simple
With its "What-If" modeling feature, the dashboard predicts when cluster capacity might run out, achieving 92% accuracy. This helps admins plan resources effectively.
Seamless Integration Across Platforms
The system supports multiple platforms, including:
- VMware vSphere (version 4.1 and newer)
- Microsoft Hyper-V (2008 R2 and later)
- Nutanix AHV clusters
- Azure and AWS EC2 instances
Optimizing Resources
By processing over 15,000 metrics per second, the dashboard identifies 20-35% of resources that can be reclaimed from underused virtual machines.
Built for Large Environments
For enterprises, features like server-side pagination enhance scalability. The PerfStack dashboard allows users to correlate virtualization metrics with overall infrastructure performance, making it easier to troubleshoot and find root causes quickly.
sbb-itb-59e1987
6. Grafana for Red Hat Virtualization
Grafana works with Red Hat Virtualization (RHV) to automate data collection from the oVirt Data Warehouse. It processes metrics to deliver detailed insights into virtualization performance.
Executive Dashboard Overview
Grafana provides tailored dashboards to monitor key metrics:
| Dashboard Type | Key Metrics | Update Frequency |
|---|---|---|
| VM Inventory | Active connections, OS distribution | Real-time |
| Resource Usage | CPU/Memory usage, Storage capacity | 1 minute |
| Service Level | Uptime tracking, Performance SLAs | 5 minutes |
| Storage Analysis | Domain capacity, I/O performance | 15 minutes |
Automated Performance Tracking
Grafana keeps an eye on essential performance metrics across the virtualization environment. For example, if CPU usage stays above 90% for more than 5 minutes, the system triggers alerts, helping administrators maintain smooth operations.
Storage Management Precision
The platform monitors domain storage usage with a precision of 0.1%, allowing administrators to address potential capacity issues before they escalate. This ensures efficient storage management across virtualized environments.
Advanced Data Retention
Grafana offers two data retention options:
- Basic Tier
- Retains 24 hours of raw samples
- Keeps hourly aggregates for one month
- Suitable for setups with up to 1,000 VMs
- Full Tier
- Stores 24 hours of raw samples
- Maintains hourly aggregates for two months
- Provides five years of daily performance history
- Ideal for enterprise-level deployments
This retention system supports long-term trend analysis and resource planning.
Streamlined Access Control
Grafana uses RHV’s built-in user management system and implements role-based access control. Users only see data relevant to their roles, ensuring security and compliance while maintaining efficient monitoring.
Performance Optimization Tools
Pre-configured panels help identify areas for improvement. For instance, the system highlights underutilized VMs – those using less than 10% CPU over a 30-day period – so resources can be reallocated effectively.
Installation and Setup
Start by enabling maintenance mode, running the reconfiguration utility, and accessing the dashboards through the RHV Engine IP. The system includes over 150 pre-configured panels, giving administrators immediate access to critical insights.
7. eG Enterprise VM Monitor
This dashboard shines by combining infrastructure and application monitoring into one streamlined view. Using a patented In-N-Out approach, it merges external hypervisor metrics with guest OS data. This dual-layered insight allows administrators to keep an eye on both infrastructure performance and application-specific resource usage at the same time.
Platform Coverage
eG Enterprise VM Monitor supports a variety of virtualization platforms, offering comprehensive monitoring capabilities:
| Platform | Monitoring Capabilities |
|---|---|
| VMware ESXi | Tracks host resources, VM metrics, and migration events like vMotion |
| Microsoft Hyper‑V | Covers dynamic memory, storage QoS, and cluster health |
| Nutanix AHV | Monitors storage pools and replication activities |
| Citrix Hypervisor | Observes user sessions, application performance, and network I/O |
Intelligent Performance Analysis
The system uses machine learning to create rolling 14-day baselines for performance metrics. When deviations occur, it automatically identifies and correlates events across the virtualization stack, ensuring a smarter approach to performance monitoring.
Root Cause Diagnostics
The platform goes beyond just identifying anomalies – it pinpoints the exact source of performance issues. Its dependency mapping tool traces problems across the entire virtualization environment. For instance, if a VM is running slowly, the system can determine whether the issue stems from:
- Host resource contention
- Storage latency
- Network bottlenecks
- Processes within the guest OS
Resource Optimization Tools
This feature helps organizations better manage their resources. For example, a financial services firm used the platform’s insights to save $240,000 annually by optimizing cloud resource allocation.
Enterprise Security Integration
Security is a key focus, with the platform offering enterprise-level protections such as:
- TLS 1.3 encryption for secure communications
- Role-based access control for user management
- AD/LDAP integration for seamless authentication
- Immutable audit logs
- Compliance support for HIPAA and PCI DSS standards
Performance Metrics
The dashboard sets itself apart with its advanced capabilities:
| Metric Type | Capability | Industry Standard |
|---|---|---|
| Monitored VM Metrics | 150+ per instance | 80–100 |
| Root Cause Detection | 92% accuracy | 67% |
| Historical Data Retention | 13 months | 6 months |
Real‑World Impact
"Our implementation of eG Enterprise for monitoring 300+ SAP application VMs reduced critical incident response time from 45 to 15 minutes through automated correlation of storage and VM performance issues", shared NMC Healthcare’s IT Director in a 2023 case study.
The platform’s real-world effectiveness is further highlighted by its success in large-scale environments. Healthcare providers, for instance, have reported a 72% reduction in Mean Time to Resolution (MTTR) for VDI deployments by using the platform to link user experience metrics with infrastructure performance.
Dashboard Feature Comparison
Virtualization dashboards stand out based on their core features, platform compatibility, and advanced functionalities. Below is a detailed comparison of the standout features and strengths of each dashboard, building on the insights shared earlier.
Core Capabilities Matrix
| Feature Category | Leading Solution | Notable Implementation |
|---|---|---|
| Historical Analysis | Red Hat Grafana | Retains data for up to 5 years |
| Pre-built Widgets | ManageEngine OpManager | Offers over 200 virtualization-specific widgets |
Hypervisor Compatibility
When it comes to hypervisor support, ManageEngine OpManager natively integrates with VMware, Citrix, and Hyper-V. On the other hand, the NetApp VM Monitor Dashboard shines in hybrid environments, seamlessly working across VMware, AWS, and Azure setups. This broad compatibility ensures smooth operation in diverse virtual ecosystems.
Performance Impact Analysis
These dashboards provide tangible improvements in production environments. A notable example is SolarWinds’ virtualization dashboard, which has enabled organizations to recover an average of 23% of unused resources in their VM deployments. This directly translates to reduced operational expenses and better resource utilization.
Advanced Diagnostic Features
Each platform takes a unique approach to diagnosing issues, offering distinct advantages:
| Dashboard | Diagnostic Strength | Impact |
|---|---|---|
| NetApp VM Monitor Dashboard | Variable-based filtering | Speeds up troubleshooting by 40% |
| Entuity | Virtual switch mapping | Improves network visibility |
| Commvault | Backup status tracking | Tracks over 1 million VMs in managed environments |
Enterprise Scalability
Scalability is a key factor for enterprise-grade solutions. Commvault stands out with its ability to monitor backups for over one million VMs in managed service provider environments. Meanwhile, ManageEngine OpManager offers a widget-based design, enabling users to create customized views for managing extensive virtual infrastructures.
Integration Capabilities
| Integration Type | Leading Solutions | Key Benefit |
|---|---|---|
| API Access | NetApp, SolarWinds | Enables custom data collection |
| ITSM Platforms | eG Enterprise, Commvault | Automates alerts for better incident response |
| Third-party Tools | ManageEngine, Entuity | Expands monitoring capabilities |
Resource Optimization
Efficient resource management is a critical focus for these solutions. SolarWinds excels with its VM sprawl identification feature, helping organizations optimize their infrastructure by automating resource rightsizing. Additionally, NetApp’s datastore latency tracking addresses a common performance bottleneck in virtualized environments. Combined with Entuity’s virtual port group monitoring, these features deliver a comprehensive view of how storage and network performance influence virtual workloads.
Summary
Virtualization monitoring tools have come a long way, each offering distinct advantages tailored to various operational needs. By focusing on key performance metrics, these tools demonstrate their effectiveness in managing virtualized environments.
Here are some standout benefits from the analysis:
Performance Impact
SolarWinds helped Memorial Healthcare cut VM downtime by 63%, while eG Enterprise maintained an impressive 99.999% uptime for Overstock.com during peak traffic periods.
Integration Capabilities
Enhanced features, like Kubernetes visibility in Commvault and AI-powered anomaly detection in eG Enterprise, highlight the growing ability of these tools to integrate with complex systems.
Resource Management
Dashboards such as Grafana–Red Hat and NetApp offer substantial resource and cost savings, emphasizing their role in optimizing virtualized environments.
These tools also benefit from robust hosting infrastructures like Serverion. With features such as 40Gbps interconnects, a distributed Anycast network with under 10ms latency, and pre-configured templates for platforms like Commvault and eG Enterprise, Serverion has cut implementation times by 40%. This infrastructure ensures seamless integration and real-time metric collection.
Each dashboard shines in its own way, depending on the use case:
| Dashboard Type | Best Suited For | Key 2025 Enhancement |
|---|---|---|
| Commvault | Multi-tenant Environments | Kubernetes Integration |
| eG Enterprise | Application-centric Monitoring | AI-powered Anomaly Detection |
| SolarWinds | Resource Optimization | Predictive Analytics |
| Grafana–Red Hat | Long-term Trend Analysis | Edge Computing Support |
As these tools continue to evolve with features like AI-driven insights and edge computing capabilities, they remain essential for efficient and reliable virtualization management.
FAQs
What should I look for when selecting a virtualization monitoring dashboard for my organization?
When selecting a virtualization monitoring dashboard, it’s important to focus on ease of use, compatibility, and features that match your organization’s specific requirements. The ideal dashboard should offer real-time insights, customizable alerts, and detailed reporting to keep you on top of your virtualized systems.
Make sure the dashboard works seamlessly with your current infrastructure and supports the virtualization platforms your organization relies on. Tools that are intuitive and user-friendly can significantly boost your team’s efficiency by saving time and simplifying workflows.
Don’t overlook scalability and support. Choose a dashboard that can adapt as your organization grows and provides dependable customer support to help resolve any issues or answer questions when needed.
How can predictive analytics in tools like SolarWinds and Commvault enhance virtualization performance and resource optimization?
Predictive analytics, featured in tools like SolarWinds and Commvault, play a key role in boosting virtualization performance. By analyzing historical data and usage trends, these tools can anticipate resource demands, allowing for smarter allocation of CPU, memory, and storage in virtualized environments.
This proactive approach to resource management minimizes downtime, avoids over-provisioning, and keeps systems running smoothly. The result? Greater reliability, reduced costs, and an overall better experience for managing virtualized systems.
What are the benefits of using Grafana for analyzing long-term trends in virtualized systems?
Grafana: A Tool for Tracking Long-Term Trends
Grafana is a go-to solution for keeping tabs on long-term trends in virtualized environments. Its interactive dashboards make it simple to track system performance over time, helping you spot patterns and address potential problems before they escalate.
What sets Grafana apart is its customizable visualizations and support for various data sources. This means you can pull data from multiple systems and bring it all together into one clear, unified view. No more juggling between tools – everything you need is in one place. Plus, Grafana’s ability to send real-time alerts ensures you’re always in the loop about critical changes, giving you the chance to act quickly and make informed decisions.


