
GCP Cloud Monitoring for Serverless Apps
Google Cloud Monitoring simplifies managing serverless applications by offering real-time insights into performance, costs, and reliability. Serverless apps, like those on Cloud Run and Cloud Functions, operate in dynamic environments, making monitoring essential to avoid performance lags, high latency, and unexpected costs. Here’s what you need to know:
- Key Metrics: Track CPU usage, memory, request latency, and instance counts to optimize performance and control costs.
- Integrated Tools: Seamlessly combines metrics, logs, and traces with tools like Cloud Logging and Cloud Trace for deeper analysis.
- Custom Dashboards: Visualize data with customizable dashboards, providing clear insights into app health and performance.
- Alerts and Notifications: Set up alerts for key thresholds (e.g., high latency or error rates) with notifications via email, SMS, or integrations like Slack.
- Cost Management: Monitor resource usage and billing data to identify inefficiencies and avoid overspending.
- Cold Start Solutions: Address latency issues by adjusting memory settings, using minimum instances, or scheduling periodic invocations.
For multi-cloud setups, GCP Monitoring supports AWS and hybrid environments, making it versatile for distributed systems. By leveraging historical data and automated responses, you can fine-tune scaling and maintain optimal app performance. Monitoring isn’t just about data – it’s about actionable insights to keep your serverless apps reliable and cost-efficient.
Monitor your Cloud Run app
Key GCP Cloud Monitoring Features for Serverless
GCP Cloud Monitoring offers a range of tools designed to improve how serverless applications perform. By bringing together metrics, logs, and traces, it provides a unified view of your serverless environment, making it easier to maintain performance and address issues quickly.
Metrics Collection and Analysis
Monitoring serverless applications starts with gathering accurate metrics. GCP Cloud Monitoring does this automatically for Google Cloud services, while also allowing you to add custom metrics and integrate external data sources for a complete picture of your system.
For Cloud Run applications, key performance metrics include:
- CPU utilization: Tracks the average percentage of allocated CPU being used across all container instances.
- Memory utilization: Shows how much of your allocated memory is actively in use.
- Request metrics: Includes request count (number of successful requests) and request latency (how long containers take to process requests). Google advises setting alerts for latencies over 500ms (warning) and 1,000ms (critical).
- Billable instance time: Monitors how long container instances consume CPU and memory, helping you manage costs effectively.
- Concurrent requests and instance count: By default, Cloud Run handles up to 80 concurrent requests per instance, adjustable between 1 and 1,000 based on your needs.
These metrics not only aid in optimizing performance but also help manage costs by identifying resource usage patterns.
| Metric | Description | Recommended Alert Threshold |
|---|---|---|
| CPU utilization | Percentage of allocated CPU being used | Above 90% for extended periods |
| Memory utilization | Percentage of allocated memory in use | Near memory limit |
| Request latency | Time to process requests | 500ms (warning), 1,000ms (critical) |
| Billable instance time | Time instances actively consume resources | Budget-based thresholds |
Logging and Troubleshooting
Metrics provide a snapshot of performance, but logs dive deeper into the details. Cloud Logging gathers logs from all GCP services automatically, requiring no manual setup. These logs include critical data like execution times, startup durations, and error details.
To make logs even more actionable, you can create log-based metrics. For example, you could set alerts for specific events, such as authentication failures or unusually long execution times. This enables you to address potential issues before they grow into larger problems.
By integrating Cloud Monitoring with Cloud Logging, you can link performance alerts directly to log entries. This allows for quicker root-cause analysis. Studies show that incorporating observability significantly improves system reliability, making this integration a key feature.
Distributed Tracing with Google Cloud Trace
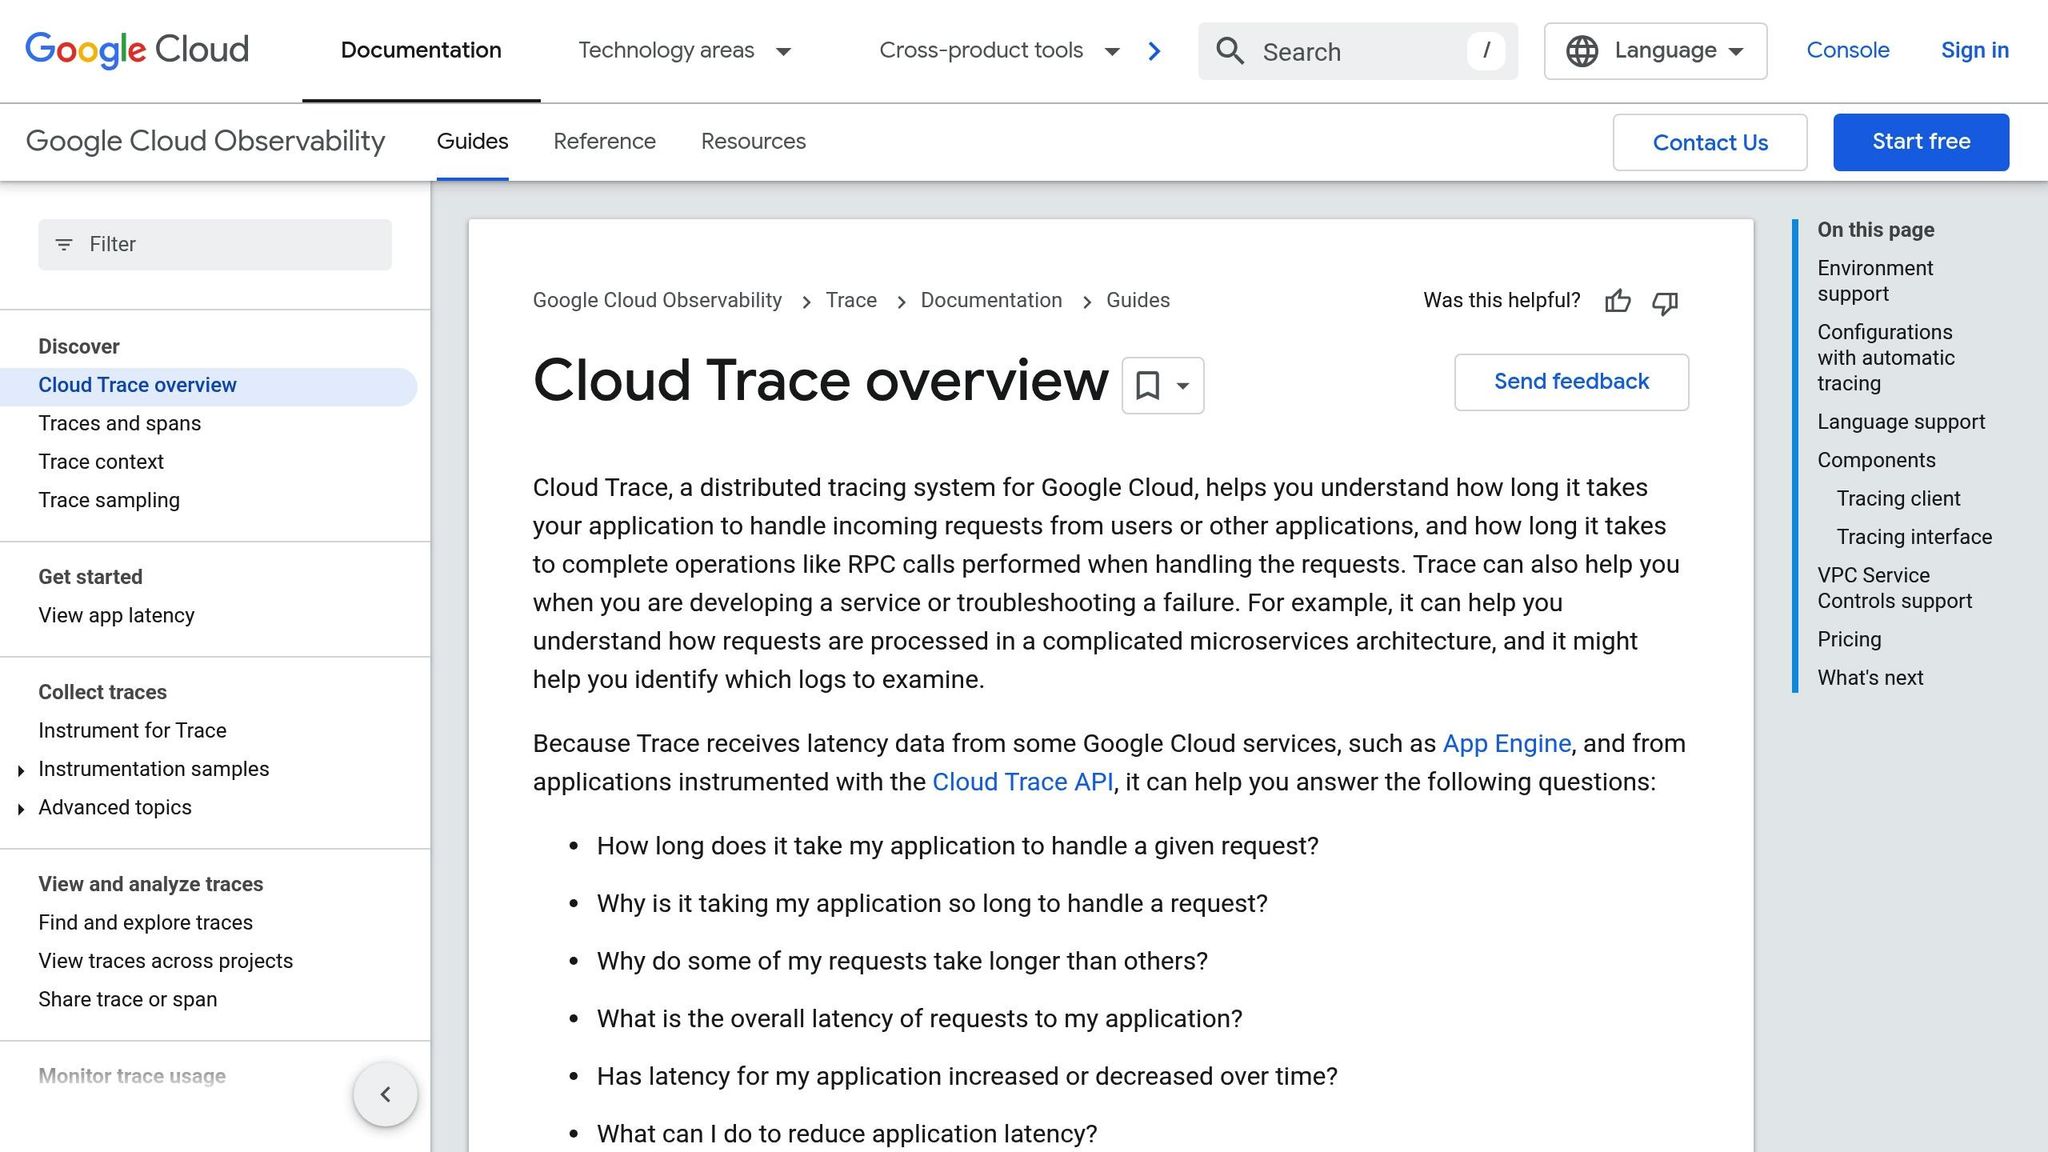
Tracing adds another layer of insight by mapping out how requests flow through your serverless architecture. Since serverless applications often involve multiple interconnected functions, tracing helps pinpoint bottlenecks and delays.
Google Cloud Trace tracks request durations across functions, identifying where delays occur. It works out-of-the-box with many GCP services and also supports custom instrumentation for application-specific data. For example, Grafana Labs demonstrated in May 2024 how to monitor Cloud Run using OpenTelemetry and Grafana Cloud, showcasing how tracing can capture interactions between distributed services.
This tracing data integrates seamlessly with metrics and logs, offering a complete view of your application’s performance. If you notice increased latency on a dashboard, trace data can help identify which function or external service is causing the slowdown.
Dashboards and Alerts
Custom dashboards turn raw data into actionable insights. GCP Cloud Monitoring supports a variety of widgets – charts, log entries, incident tables, and more – to create tailored views of your system’s health. You can add filters, use variables to adjust queries, and organize data into sections for better clarity. Dashboards can include up to 100 widgets, with revisions stored for 90 days.
Alerts are another cornerstone of effective monitoring. You can set up alerting policies to notify your team when specific conditions are met, whether it’s time-series data, log entries, or SQL query results. Alerts can be configured through the Google Cloud Console, API, CLI, or Terraform, with pre-built packages available for common use cases.
The alerting system supports multiple notification channels, including email, SMS, mobile push notifications, and tools like Slack. Each alert policy includes conditions, notification methods, and documentation to help your team respond effectively. For advanced scenarios, you can use PromQL to create dynamic thresholds and complex alerting logic.
To keep everything in one place, alerts and incidents can be displayed directly on dashboards. This unified view helps your team monitor both system health and active issues at a glance.
GCP Cloud Monitoring also balances cost-effectiveness with functionality. System metrics for Google Cloud services are free, while custom metrics and external data sources are billed based on data volume. Alerts and uptime checks come with generous free limits, ensuring you can monitor extensively without overspending.
These features provide the tools needed to effectively manage and monitor serverless applications, combining performance insights with cost control.
Monitoring Serverless Platforms on GCP: Best Practices
Keeping tabs on serverless platforms requires more than just tracking basic metrics. It’s about ensuring visibility and fine-tuning performance for optimal results. Let’s dive into some proven strategies for monitoring Cloud Run and Cloud Functions effectively.
Monitoring Google Cloud Run and Cloud Functions
Both Cloud Run and Cloud Functions offer built-in tools to gather essential telemetry data right out of the box. But to truly make the most of these tools, you need to know how to use them strategically.
Cloud Run automatically tracks metrics like container lifecycle events, request patterns, and resource usage – no extra setup needed. For deeper monitoring, it supports multi-container deployments. This means you can add sidecar containers specifically for tasks like logging, tracing, and monitoring. A key tip: ensure these monitoring sidecars start up before your application containers to avoid losing data.
Cloud Functions, on the other hand, seamlessly integrates with Cloud Logging and Cloud Monitoring. It captures critical data like function invocations, execution times, and memory usage. For functions interacting with external services, adding custom instrumentation can provide a more complete picture of request flows.
One crucial aspect for both platforms is monitoring costs. Keep an eye on unit costs and resource usage to identify areas where you can optimize and avoid over-provisioning. If you’re looking to take things further, tools like OpenTelemetry can add even more depth to your observability setup.
Using OpenTelemetry for Better Observability
OpenTelemetry is an open-source framework designed to handle telemetry data – like logs, metrics, and traces – in a vendor-neutral way. With support from over 40 observability vendors, it’s a flexible choice for monitoring serverless platforms. Its push-based OpenTelemetry Protocol (OTLP) is especially useful for short-lived serverless tasks, where traditional pull-based methods might fall short.
A great example of OpenTelemetry in action comes from Grafana Labs. In May 2024, they demonstrated how to use OpenTelemetry with Google Cloud Run for a Node.js application. By leveraging auto-instrumentation, they efficiently exported telemetry data to Grafana Cloud, showcasing a practical way to analyze Cloud Run services.
To centralize telemetry, deploy the OpenTelemetry Collector as a sidecar container. Make sure it starts before your application containers. The collector uses a configuration file (config.yaml) to define what data to collect and where to send it. You can then configure your apps to send OTLP traces and metrics to the collector’s endpoint.
For smoother workflows during development, tools like Skaffold can help manage the build and deployment process for OpenTelemetry-instrumented Cloud Run applications. This simplifies handling multiple containers and their dependencies.
Setting Up Alert Policies
Monitoring isn’t just about collecting data – it’s about acting on it. That’s where well-thought-out alert policies come in. GCP Cloud Monitoring offers a robust alerting system, but its effectiveness depends on how you set it up.
Start by defining clear goals and focusing on key metrics that directly impact your application’s performance. Metrics like response latency, error rates, and availability should take priority. Avoid overloading your system with alerts for every possible metric – this can lead to “alert fatigue,” where important notifications get lost in the noise.
Budget alerts are particularly important in serverless environments, where costs can spike unexpectedly. Set thresholds to flag unusual spending patterns, which could signal security issues or runaway processes.
Make sure alerts reach the right people with enough detail to act quickly. Use multiple notification channels – like email, Slack, SMS, PagerDuty, or ServiceNow – to ensure on-call staff are always in the loop.
For security, set up alerts for critical events such as changes to IAM policies, firewall rules, or unusual access patterns. These alerts should have stricter thresholds and faster notification times since security incidents require immediate attention.
sbb-itb-59e1987
Performance Optimization with GCP Cloud Monitoring
GCP Cloud Monitoring offers tools that go beyond simple monitoring, providing actionable insights to enhance performance. By analyzing this data, you can address common challenges like latency and cold starts while making smarter decisions about scaling and resource management.
Fixing Cold Starts and Latency Issues
Cold starts can be a major hurdle in serverless computing. When a function is triggered after being idle, the process of spinning up a new instance can cause noticeable delays. To tackle this, monitor cold start metrics such as execution time and memory usage. For example, testing different memory configurations – like comparing 256 MB to 2 GB – can reduce latency by as much as 50%.
"In most instances, the signals that provide the richest information for latency are traces." – Eyamba Ita, Product Manager, Google Cloud
Memory allocation plays a significant role here. Functions with 2 GB memory often perform much faster than those with lower allocations. Use Cloud Monitoring to experiment with various memory settings to find the right balance between speed and cost.
The programming language you use also affects cold start times. For instance, Node.js functions might face delays of around 200 milliseconds, while Python functions could experience delays nearing 1 second. Compiled languages like Go, Rust, or Java generally have quicker cold starts compared to interpreted languages.
For Cloud Run applications, cold starts can be minimized by configuring minimum instances. As shared by mcbsalceda from the Google Cloud Community:
"Cold starts on Cloud Run can be managed by setting up ‘minimum instances.’"
Another effective strategy is scheduling periodic invocations during low-traffic periods to keep functions warm, which can lower latency by up to 60%. Additionally, API Gateway caching can prevent unnecessary function executions, reducing cold invocations and execution costs by as much as 60%.
Beyond addressing cold starts, historical data can refine your approach to scaling.
Using Historical Data for Scaling Decisions
Historical data from Cloud Monitoring is a powerful tool for making smarter scaling decisions. Instead of relying on estimates, you can analyze real usage patterns to optimize CPU, memory, and concurrency settings.
Start by reviewing trends in billable instance time to pinpoint peak usage periods. This allows you to allocate resources based on actual demand and set realistic budgets, avoiding unexpected costs during traffic surges.
Even minor delays can affect user satisfaction, leading to fewer conversions or signups. By using historical data, you can strike the right balance between cost and performance. For example, analyze how your app handled traffic spikes during key events in the past. This helps ensure the app is meeting business goals during critical periods while uncovering patterns that may not be evident through real-time monitoring.
Research from Amazon Web Services highlights that event-driven systems can boost throughput by up to 50% during peak loads. Historical data can reveal where adopting an event-driven architecture would make the most sense.
Use this data to fine-tune autoscaling settings. Monitor metrics like request latency, traffic patterns, and concurrency to decide whether always-on instances are worth the cost or if cold starts are acceptable.
Caching also plays a major role in scaling. According to Varnish Software, organizations can serve over 90% of their traffic from the cache. Historical insights help identify which content benefits most from caching and inform when to implement these optimizations.
With a solid understanding of historical trends, you can move toward automating responses for improved efficiency.
Automating Responses Based on Monitoring Data
The ultimate goal of monitoring is to create systems that adapt automatically to changing conditions. GCP Cloud Monitoring enables you to build workflows that handle performance issues without constant manual intervention.
Set up automated scaling policies based on specific metrics. For example, if monitoring data shows consistent latency spikes during peak hours, you can configure automatic resource adjustments to prevent performance drops.
Outages provide valuable data for identifying bottlenecks and dependencies in your application. Use this information to implement automated circuit breakers and fallback mechanisms that prevent cascading failures.
Integrate Cloud Monitoring with tools like Cloud Logging, Error Reporting, and Cloud Trace to trigger scaling or remediation actions when error rates or latency exceed thresholds.
Security is another area where automation shines. Cloud Monitoring can track security-related metrics and detect anomalies. You can set up automated responses to restrict access, scale down affected resources, or activate additional security measures when threats are detected.
The Network Intelligence Center offers a Performance Dashboard that tracks packet loss and latency across Google’s network. This data can be exported to Cloud Monitoring to automate traffic routing decisions, ensuring your app always uses the fastest network paths.
With spans stored for 30 days at no extra cost, you have ample historical data to refine your automation rules. This allows you to continuously improve how your systems respond to different scenarios.
Basic system metrics for Google Cloud services are free, making it affordable to implement comprehensive automated monitoring. While custom metrics may incur charges after the free tier, the benefits – like enhanced performance and reduced manual workload – often outweigh the costs.
Conclusion
GCP Cloud Monitoring offers powerful tools for managing serverless environments with precision and efficiency. By tracking key metrics like execution count, duration, memory usage, and active instances, it provides a clear window into the performance of your Cloud Functions and Cloud Run applications. This visibility is essential for tackling the unique challenges of serverless workloads.
For organizations embracing serverless architectures, effective monitoring can translate into impressive results: up to 30% faster loading speeds, 70% quicker development cycles, and a 30% drop in operational costs compared to traditional setups. These benefits are driven by GCP Cloud Monitoring’s ability to transform raw data into actionable insights using intuitive dashboards, real-time alerts, and integrated logging tools.
Cost efficiency is another standout feature. Google Cloud service metrics come at no extra charge, and generous limits on alerting policies and uptime checks mean teams can monitor comprehensively without worrying about hidden fees. This makes it easier to implement robust monitoring while staying within budget.
For instance, when deploying a new version of a Cloud Function, any error spikes are immediately visible through Cloud Monitoring’s dynamic charts. You can also configure alerts – like notifications for error rates exceeding 5% over a 5-minute period – to quickly address potential issues before they escalate.
To maximize these benefits, disciplined monitoring practices are key. By setting clear performance goals aligned with business objectives, continuously tracking system health, and focusing on metrics that directly impact user experience, teams can detect anomalies early and make smarter capacity planning decisions. This proactive approach ensures serverless applications remain reliable, responsive, and ready to meet performance targets.
With its global reach and comprehensive monitoring capabilities, GCP Cloud Monitoring empowers organizations to build scalable, dependable serverless infrastructures. It equips teams to adapt to changing demands while delivering seamless user experiences, making it a cornerstone for any serverless strategy.
FAQs
How can GCP Cloud Monitoring help control costs for serverless applications?
How GCP Cloud Monitoring Manages Serverless Costs
GCP Cloud Monitoring provides tools to help you keep serverless application costs under control. With custom metric filters, you can track specific usage patterns that matter most to your application. Features like aggregation let you analyze trends over time, giving you a clearer picture of your resource consumption. Plus, you can set up budget alerts to get notified when spending approaches your defined thresholds, helping you avoid surprises.
Another handy feature is the ability to consolidate alert policies. This simplifies notifications, so you can focus on the most important cost-related updates, making it easier to manage your serverless environment efficiently.
How can I use GCP Cloud Monitoring to address cold start issues in serverless applications?
To cut down on cold start delays in serverless applications, GCP Cloud Monitoring offers valuable tools to spot patterns and fine-tune performance. Here are a few effective strategies:
- Set a minimum number of instances: For example, use
--min-instances=1to keep at least one instance running, ensuring resources are always ready. - Streamline startup processes: Keep shared data in memory and optimize how your application initializes to reduce startup time.
- Use Cloud Run’s Min Instances: This feature helps maintain "warm" instances, so your application is prepared to handle incoming requests quickly.
By keeping an eye on performance metrics and tweaking your configurations, you can enhance response times and deliver a smoother experience for your users.
How do I use OpenTelemetry with GCP Cloud Monitoring to improve observability in serverless applications?
To set up OpenTelemetry with GCP Cloud Monitoring, you’ll need to deploy the OpenTelemetry Collector. This tool collects traces and metrics from your serverless applications. Once deployed, configure the collector to export data using the OpenTelemetry Protocol (OTLP) to both Cloud Monitoring and Cloud Trace. The best part? This method supports auto-instrumentation, so you can capture telemetry data without modifying your application code.
Using OpenTelemetry gives you a clearer view of how your serverless applications are performing and behaving, helping you pinpoint issues and fine-tune performance with ease.


