
Incident Response for AI: Key Metrics to Track
AI systems fail differently from traditional IT systems – issues like accuracy drops, bias, or data leaks often go unnoticed for days. Between 2023 and 2024, AI-related incidents surged by 56.4%, with detection times averaging 4.5 days. This delay poses risks, especially as regulations like the EU AI Act mandate reporting serious incidents within 15 days.
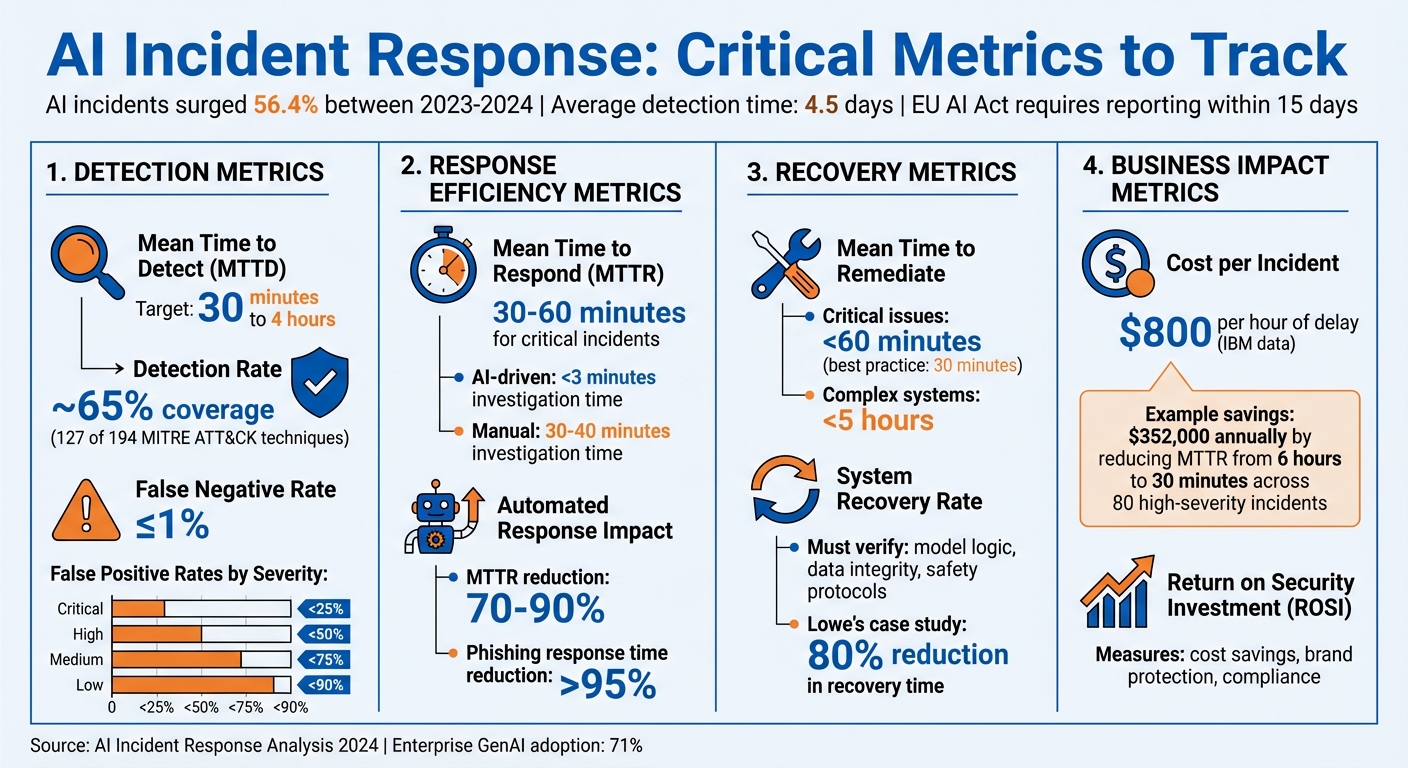
To manage AI failures effectively, you need to track metrics that measure detection, response, and recovery. Key metrics include:
- Mean Time to Detect (MTTD): Measures how quickly incidents are identified.
- Detection Rate: Tracks how many incidents are accurately flagged.
- Mean Time to Respond (MTTR): Evaluates how fast teams act after detection.
- False Positive/Negative Rates: Balances alert accuracy to avoid missed threats or unnecessary noise.
- Cost per Incident: Quantifies the financial impact of delays and poor responses.
- Return on Security Investment (ROSI): Shows how security tools save money and reduce risks.
AI failures require proactive monitoring and tailored response strategies. Metrics like these ensure your systems are not only functional but also safe and reliable.
Key AI Incident Response Metrics and Benchmarks
Incident response planning in the age of AI
sbb-itb-59e1987
Detection Metrics
Detection metrics help measure how quickly and accurately your system identifies AI-related incidents, such as drift, bias, or hallucinations. These metrics act as your first line of defense against potential harm.
Mean Time to Detect (MTTD)
MTTD calculates the average time it takes to detect an incident from the moment it occurs. For AI systems, this metric is crucial because issues like attacks or system failures can escalate rapidly.
Leading security teams aim for an MTTD of 30 minutes to 4 hours. Delays beyond this window significantly increase risk. Take the Microsoft Midnight Blizzard attack from November 2023 as an example. It wasn’t discovered until January 12, 2024 – resulting in a two-month MTTD. This extended detection time turned what could have been a minor breach into a major compromise.
"A shorter MTTD generally indicates that an organization is able to detect security incidents more quickly and respond to them more effectively." – Katie Bykowski, Swimlane
To improve MTTD, broaden your telemetry to include AI-specific and cloud-native attack patterns. After every incident, review logs to refine your detection points and update your logic. Considering ransomware operators can complete their objectives in under 24 hours, faster detection is essential to limit potential damage.
Detection Rate
Speed isn’t the only factor – accuracy matters too. Detection rate measures the percentage of actual incidents that your monitoring systems successfully identify.
You can calculate detection coverage by dividing the number of active, tested detections by the total number of techniques in a framework like MITRE ATT&CK, which lists 194 techniques. While perfect coverage isn’t feasible, most organizations find that ~65% coverage (around 127 techniques) is enough to address common threat behaviors. The focus should be on mapping your detection capabilities to frameworks and identifying gaps in coverage.
"It used to take us days to find out about issues with a new release. Now… we can pinpoint and fix a problem on the same day so that customers can place orders seamlessly." – Willie James, Director of Resiliency Services, Papa Johns
Historical breaches highlight the cost of poor detection rates. For instance, the 2017 Equifax breach went undetected for over 70 days, and the 2019 SolarWinds attack stayed hidden for roughly six months. For AI systems, traditional metrics often fall short when addressing silent failures like model drift, which can erode performance without triggering alarms. Behavioral monitoring, not just accuracy checks, is key to maintaining strong detection rates.
Balancing detection coverage with precision brings us to the importance of managing false positives and false negatives.
False Positive and False Negative Rates
False positives occur when normal system behavior is mistakenly flagged as an issue. False negatives, on the other hand, are real threats that go unnoticed – posing severe risks as they quietly cause damage.
Excessive false positives can overwhelm teams with unnecessary alerts, while overly strict thresholds can lead to dangerous false negatives.
"The only thing worse than a false positive is a false negative in which a serious threat is overlooked because a tool was turned down too far." – Katie Bykowski, Swimlane
High-performing security teams aim for a false negative rate at or below 1%. False positive rates, however, vary depending on the severity of alerts:
| Alert Severity | Target False Positive Rate |
|---|---|
| Critical | < 25% |
| High | < 50% |
| Medium | < 75% |
| Low | < 90% |
AI incidents add another layer of complexity. Silent failures, such as hallucinations – outputs that are confidently wrong – may not trigger error logs. To address this, establish feedback loops in your incident management process to adjust thresholds continuously. Regularly monitor input distributions to detect data drift early, ensuring your AI systems remain reliable and effective. This proactive approach helps maintain both system integrity and operational stability.
Response Efficiency Metrics
When an AI incident arises, acting quickly is critical. Building on detection metrics, speeding up response times – measured through metrics like MTTR and MTTA – can significantly reduce the risks associated with AI failures. These metrics evaluate how fast your team moves from identifying an issue to taking action, directly influencing the potential impact of an incident.
Mean Time to Respond (MTTR)
MTTR measures the average time it takes to detect, resolve, and restore systems after an incident. For AI systems, this is especially important because threats can spread at machine speed. What takes an attacker seconds could take a response team much longer to contain.
AI tools can drastically improve response times. For example, AI-driven processes can cut investigation times to under 3 minutes, compared to the 30–40 minutes often required for manual efforts.
In critical situations, organizations should aim for MTTR under 30–60 minutes. Faster responses mean less downtime and reduced costs.
"When AI systems can investigate alerts in less than a minute and provide decision-ready reports, the traditional MTTR clock starts ticking differently." – Ajmal Kohgadai, Director of Product Marketing, Prophet Security
To achieve shorter MTTR, consider using Security Orchestration, Automation, and Response (SOAR) platforms to handle repetitive tasks like enriching alerts and notifying key stakeholders. Unified SIEM/XDR platforms can also centralize visibility, making it easier to access essential data and respond quickly.
Improving MTTR also lays the groundwork for faster alert acknowledgments, as measured by MTTA.
Mean Time to Acknowledge (MTTA)
MTTA tracks the time between when an alert is generated and when it is acknowledged, either by a person or an automated system. This metric can reveal whether your team is overwhelmed by too many alerts or if there are gaps in coverage during certain times.
AI systems can instantly begin investigating alerts, often reducing MTTA to nearly zero. This is crucial for enterprise SOCs, which may handle over 10,000 alerts daily – an unmanageable volume for manual processes alone.
"MTTA (Mean Time to Acknowledge) measures the time until an analyst begins investigating an alert… In tightly integrated environments, AI SOC Analysts begin investigations immediately, effectively eliminating MTTA in many cases." – Prophet Security
As AI takes over initial triage, the focus shifts to "Mean Time to Human Decision", which measures the time from when an AI completes its report to when a human analyst either approves or escalates the decision. This helps gauge whether AI outputs are clear and actionable. To improve MTTA, set up recurring alerts to notify on-call staff promptly and use MTTA data to adjust staffing during high-alert periods.
Automated Response Rate
Speeding up initial responses is just the beginning. Automating resolutions takes efficiency to the next level by reducing MTTR from hours or days to mere seconds or minutes. The automated response rate measures how many incidents are resolved without human intervention, improving overall response effectiveness.
For instance, in 2025, a digital insurance company serving nearly 2 million customers implemented AI SOC analysts to handle their overwhelming alert volume. The result? Continuous 24/7 monitoring, no missed alerts, fewer false positives, and significant cost savings by avoiding additional hires. Their human team could then focus on high-priority security issues instead of repetitive tasks.
"Dropzone saves you and your team so much time from redundant tasks that no one wants to do… It allows you to solve critical problems that you and your team don’t have the bandwidth to solve." – Security Team Member, Digital Insurance Company
AI SOC systems can cut MTTR by 70%–90%. For high-volume incidents like phishing, automation can slash response times by over 95%. To maximize efficiency, identify predictable, frequent incidents – like password resets or handling known malware – as prime candidates for automation. Use confidence scoring to decide which incidents can be fully automated and which need human input. Finally, integrate your automation tools with all detection systems to eliminate data silos that slow down responses.
| Response Type | Speed | Scalability | Consistency |
|---|---|---|---|
| Manual Response | Minutes to hours | Limited by headcount | Variable by experience |
| Automated Response | Seconds to minutes | Virtually unlimited | Standardized execution |
Fine-tuning these response efficiency metrics enhances earlier detection efforts and strengthens your overall incident management approach.
Remediation and Recovery Metrics
Quick action is essential during incidents, but the ultimate goal is to ensure a full and reliable resolution. Remediation and recovery metrics help confirm that incidents are resolved completely and systems are restored to dependable operation.
Mean Time to Remediate
Mean Time to Remediate (MTTR) tracks the entire process from detection to resolution. It’s calculated by dividing the total time spent on remediation by the number of incidents resolved. For AI systems, this includes triage, diagnostics, repairs, and validation steps.
Interestingly, about 90% of companies start measuring MTTR only after a ticket is created, which can hide significant delays. Best practices, however, recommend starting the clock at the moment of detection.
"90% of companies don’t start measuring for any MTTx results until a ticket is created. When you skip steps in the process, however, you manipulate the results of MTTR." – Brian Amaro, Sr. Director Global Solutions, ScienceLogic
Top-performing organizations aim to remediate critical AI system issues in under 60 minutes, with some targeting resolutions within 30 minutes. For more complex setups, a benchmark of under five hours is common.
To speed up remediation, focus on automating diagnostics, maintaining detailed runbooks for frequent issues, and centralizing system monitoring. Post-incident reviews can help pinpoint delays caused by approval bottlenecks, incomplete documentation, or coordination challenges.
System Recovery Rate
Once remediation is complete, recovery metrics ensure that the fixes are both effective and comprehensive.
The System Recovery Rate measures the percentage of AI systems restored to full operational status following an incident. Unlike traditional IT recovery, which focuses on server uptime, AI recovery must confirm that model logic, data integrity, and safety protocols are intact – not just that the system is running.
Recovery is only complete when the system operates safely with verified fixes. This includes addressing issues like model drift or bias that may arise after an incident. Traditional recovery metrics often fall short here because AI failures tend to be unpredictable and complex.
With AI-related incidents projected to rise by 56.4% in 2024 and enterprise adoption of GenAI reaching 71%, recovery strategies need to adapt. Effective recovery involves verifying model logic, ensuring data integrity, and maintaining safety measures. Keeping a library of validated model versions and using tools like feature gates or kill switches can help manage unstable components.
For critical systems, consider implementing "safe modes" where processing shifts to human-only operations if AI outputs become unreliable. During recovery, staged rollouts allow for controlled testing of fixes before full deployment. Lowe’s SRE team showcased the value of structured recovery, cutting their mean time to recovery by over 80% through disciplined incident management practices.
Measuring recovery ensures that systems are not just operational but also safe and reliable.
First-Time Fix Rate
A high first-time fix rate is crucial for preventing recurring issues and building long-term resilience.
This metric tracks the percentage of incidents resolved successfully on the first attempt. For AI systems, it’s especially important because failures are often probabilistic rather than straightforward – quick fixes can overlook deeper problems like data drift or model bias.
Repeated failures can quickly erode trust, especially since AI decisions often have direct safety or financial consequences.
To improve first-time fix rates, categorize common errors and share them with development teams for root cause analysis during post-incident reviews. Build a centralized knowledge base documenting solutions to past AI issues and detailing model-specific nuances. This prevents responders from wasting time rediscovering fixes for known problems. SOAR platforms can also help by automating standardized remediation steps, reducing human error and improving consistency.
Assign clear ownership roles, such as "model owner" or "data owner", ahead of time to ensure the right expertise is available during incidents. Regular simulations and drills – practicing procedures like model rollbacks or activating kill switches – can prepare teams to handle incidents effectively the first time.
"Incident response for AI is not about eliminating failure, but about minimizing harm when failure occurs." – Timnit Gebru, Distributed AI Research Institute
Business Impact Metrics
Business impact metrics shed light on the financial consequences of AI-related incidents. They create a direct link between how well incidents are managed and the financial outcomes, making it easier to justify spending on security measures and to show the benefits of being prepared.
Incident Containment Rate
The Incident Containment Rate evaluates how effectively you can stop AI incidents from escalating, measured by the Mean Time to Contain (MTTC) – the time it takes from detecting an issue to isolating the affected resources.
For AI systems, containment is more nuanced than in traditional IT. It’s not just about disabling compromised credentials or shutting down a server. It might mean rolling back to an earlier model version, using feature gates to disable certain AI functionalities, or switching to manual fallback modes when automated systems fail.
"A lower MTTC means your containment playbooks and automation are working – and you’re limiting the blast radius before attackers get comfortable." – Wiz
AI failures often bring unique challenges because they can be non-deterministic. For example, issues like indirect prompt injection are ambiguous and technically tricky, making it hard to determine when an incident is fully contained. That’s why it’s important to define containment criteria for specific AI failure types – like data leaks versus model poisoning – before problems arise.
With 71% of enterprises now using GenAI but fewer than one in seven fully prepared for AI security risks, containment speed and effectiveness are critical. Attackers can move laterally across cloud services in a matter of minutes, so identifying high-risk pathways in your AI setup and implementing kill switches for rapid manual containment can make all the difference.
These containment strategies lay the groundwork for measuring the financial impact of incidents.
Cost per Incident
Every hour an AI-related incident goes unresolved adds to the financial toll. According to IBM, each hour of delay during a security breach costs about $800. For AI systems, these incidents disrupt uptime, compromise data integrity, and erode customer trust, all of which drive up costs.
You can calculate your cost per incident using this formula: (Total Investigations per Year) × (% High-Severity Rate) × (Hours of Delay) × (Hourly Cost of Breach). Focus on high-severity incidents, which typically make up about 1% of all alerts, as they have the most significant financial impact.
Streamlining AI incident response can dramatically reduce these costs. For instance, autonomous alert investigation can cut the Mean Time to Respond from six hours to just thirty minutes in high-severity cases. Reducing response time by 5.5 hours across 80 high-severity incidents could save $352,000 annually.
When calculating costs, include both direct expenses like operational disruptions and remediation efforts, as well as indirect impacts like data exposure and lateral movement. If your organization runs AI workloads on specialized infrastructure, also account for the costs of managing AI GPU servers during recovery. Services like Serverion’s AI GPU server management can help minimize downtime and reduce operational expenses by providing reliable infrastructure with built-in monitoring and support.
Tracking metrics like "cost per high-severity delay" and "mean analyst time per alert" can help fine-tune your calculations and identify areas where automation can save the most money.
Return on Security Investment (ROSI)
Building on incident cost data, Return on Security Investment (ROSI) quantifies the financial benefits of investing in strong response tools. It highlights the value of security investments by demonstrating cost savings, protecting your brand, and meeting compliance requirements. For AI incident response, ROSI justifies spending on tools and infrastructure that limit the impact of incidents.
AI failures, such as data drift or hallucinations, often go unnoticed but can cause financial harm over time. Traditional uptime metrics may show systems running smoothly, even as flawed outputs quietly drain resources or harm business operations.
"Organizations must treat AI incidents as socio-technical events, not just engineering bugs." – Kate Crawford, AI Now Institute
To calculate ROSI for AI incident response, connect technical impacts – like compromised identities, affected resources, or data leaks – to business-critical services. Track metrics such as the number of affected identities and the lateral spread of incidents across regions to estimate potential costs. Efficiency metrics like "incidents per person-hour" can also demonstrate the value of adding analysts or automating response processes.
Strong incident response capabilities don’t just cut costs – they also build trust. Faster recovery times and better preparedness give organizations a competitive edge. When you can show that your security investments have saved hundreds of thousands of dollars annually, it becomes much easier to make the case for continued or increased funding.
Conclusion
Tracking the right metrics turns AI incident response into a well-structured, data-focused process. Metrics like Mean Time to Detect (MTTD), Mean Time to Respond (MTTR), Cost per Incident, and Return on Security Investment (ROSI) lay the groundwork for identifying operational weaknesses, addressing high-risk alerts, and managing resources more effectively.
AI failures often creep in through issues like data drift or model hallucinations. Because these failures are probabilistic, they require ongoing monitoring – quick fixes and traditional metrics like uptime just don’t cut it.
"Incident response for AI is not about eliminating failure, but about minimizing harm when failure occurs." – Timnit Gebru, Distributed AI Research Institute
Using multiple metrics together – commonly referred to as triangulation – offers a clearer view of your incident response maturity. Breaking down data by severity ensures that critical issues get the attention they need. Meanwhile, tracking quality indicators like the Reopen Rate can reveal whether resolutions are targeting core problems or just treating symptoms. A well-rounded metric strategy strengthens both detection and response while bolstering infrastructure resilience. For organizations relying on specialized AI infrastructure, evaluating operational costs and recovery capabilities is equally important. Reliable hosting options, such as those from Serverion, can help reduce downtime and maintain continuity.
In the long run, this approach leads to cost efficiency, stronger relationships with regulators and customers, and a more knowledgeable team. With the frequency of incidents rising, the real challenge isn’t preventing failure altogether – it’s ensuring your response is swift and effective.
FAQs
What are the first 3 AI incident metrics to track?
The three most important metrics to keep an eye on for AI incidents are detection time, response time, and system recovery rates. These metrics help gauge how fast problems are spotted, tackled, and resolved, which is crucial for keeping your AI systems dependable and secure.
How can we detect model drift and hallucinations faster?
Detecting model drift and hallucinations quickly means keeping a close eye on how the model performs, the quality of the data it processes, and how consistent its predictions are. Tools like real-time anomaly detection and behavioral monitoring can flag issues as soon as they arise. On top of that, tracking system metrics in real time provides an extra layer of insight, making it easier to spot unexpected outputs or anomalies before they escalate.
How do we calculate cost per AI incident and ROSI?
To figure out the cost per AI incident, take the average expense of a high-severity incident (for example, $800 per hour) and multiply it by the response time, commonly referred to as MTTR (Mean Time to Respond). Calculating ROSI (Return on Security Investment) involves assessing both risk reduction and financial savings. For instance, reducing MTTR can lead to significant annual savings – potentially thousands of dollars – by enabling quicker detection and response.


