
How to Monitor Hybrid Cloud Performance
- Centralize Monitoring: Use a unified platform to track data across cloud and on-premises systems.
- Set Baselines: Define "normal" performance metrics like CPU usage, memory load, and latency.
- Track Key Metrics:
- Compute & Storage: Monitor CPU, memory, disk IOPS, and latency.
- Network: Watch bandwidth, packet loss, and latency between systems.
- User Experience: Measure Time to First Byte (TTFB), page load times, and error rates.
- Automate Alerts: Use smart alerts with dynamic thresholds to reduce false positives and respond quickly.
- Leverage AI: Apply AI for anomaly detection and predictive analytics to identify issues early and plan capacity needs.
Quick Tip:
Start with a clear inventory of your hybrid assets, map dependencies, and select a monitoring tool that integrates seamlessly across all environments. Use AI and automation to reduce manual effort and improve response times.
Monitoring and Optimizing a Hybrid Cloud Environment
Set Up Unified Monitoring Across Your Hybrid Environment
To effectively monitor a hybrid cloud setup, the first step is bringing all your tools and data streams into one cohesive system. Start by cataloging all your assets – this includes physical servers, virtual machines, cloud instances, network devices, and edge locations. Once you’ve listed everything, map out how these components interact and rank them based on their importance to your business and SLA requirements. This inventory will help you identify which elements need monitoring the most.
Select a Monitoring Platform
Your monitoring platform should work seamlessly across both on-premises data centers and cloud providers. Look for tools that offer REST APIs and pre-built plugins for platforms like AWS, Azure, and GCP. It should support agent-based monitoring for newer systems and agentless options like SNMP polling for older hardware where agents can’t be installed. Unified platforms often lead to measurable improvements, such as reducing Mean Time to Detect (MTTD) and Mean Time to Resolve (MTTR) by 15–20%, and in some cases, cutting annual costs by millions.
When choosing a platform, pay close attention to its pricing model. Many modern solutions use consumption-based pricing tied to the amount of data ingested. On average, a single virtual machine generates between 1 GB and 3 GB of monitoring data monthly, so factor this into your budget.
Configure Centralized Dashboards
Create a centralized dashboard that aggregates real-time data from all your environments. Deploy a unified monitoring agent – such as Azure Monitor Agent or AWS SSM Agent – on both cloud-based virtual machines and on-premises servers to ensure consistent data collection. For systems without direct internet access, like branch offices, set up a monitoring gateway to gather data locally and securely send it to your central workspace. The dashboard should correlate key metrics, such as latency and error rates, across all environments, eliminating the need to jump between multiple consoles. Use pre-configured templates for services like EC2, Lambda, or Kubernetes to quickly gain visibility without extensive setup.
Define Baseline Performance Metrics
Understanding what "normal" looks like is crucial before you can identify issues. Use historical data to define baseline performance levels for metrics like CPU usage, memory load, network latency, and storage IOPS across your entire hybrid infrastructure. Document these benchmarks for each component – they’ll serve as your reference point for spotting anomalies. For instance, you might aim to reduce MTTR from 4 hours to 3.2 hours within 90 days, and further down to 2.5 hours within six months. These baselines also enhance the accuracy of AI-driven anomaly detection by minimizing false alerts. Once your baselines are established, start tracking these metrics closely to ensure your system stays on track.
Track Key Performance Metrics
Once you’ve set your baselines, the next step is to keep an eye on key metrics across compute/storage, network performance, and application experience. These metrics give you a clear picture of your hybrid cloud’s health. By building on your unified dashboard and baseline definitions, you can maintain consistent performance monitoring.
Monitor Compute and Storage Metrics
Set up alerts to flag potential resource constraints before they become major issues. For example, trigger alerts when CPU usage exceeds 80% for more than five minutes or memory usage surpasses 90%. High memory usage can lead to systems swapping to disk, which slows down application performance significantly. These thresholds can seamlessly integrate with automated alerts, ensuring smooth monitoring across environments.
For storage, focus on metrics like disk IOPS (input/output operations per second) and disk latency. If disk operations for high-performance workloads exceed 1,000 per second, it might be time to investigate further – though exact thresholds depend on your application needs. Also, keep an eye on average disk transfer times; spikes here often indicate storage bottlenecks. With Google Cloud’s Compute Engine, you gain access to over 25 system metrics per VM instance, offering detailed insights without extra setup.
Monitor Network Performance Metrics
In hybrid environments, network performance is a critical factor since data often flows between on-premises systems and cloud providers. You’ll want to monitor bandwidth, inter-site latency, and packet loss. Even minor packet loss can hint at hardware or routing issues.
Pay extra attention to packet errors – both inbound and outbound. Any value above zero should be investigated immediately. Additionally, track TCP connection establishment times; delays here might signal network congestion or routing inefficiencies. Traditional monitoring tools often miss problems that occur in the "gaps" between environments, so it’s crucial to monitor boundaries where traffic transitions.
Monitor Application and User Experience Metrics
While infrastructure metrics focus on server performance, application metrics shed light on user satisfaction. One key metric to track is Time to First Byte (TTFB), which includes DNS resolution, TCP connection setup, TLS handshake, and server processing time. Delays in any of these steps can indicate issues during environment transitions.
Other important metrics include page load times and Core Web Vitals (such as Largest Contentful Paint, Interaction to Next Paint, and Cumulative Layout Shift). Together, these reveal how your hybrid setup impacts the overall user experience.
Error rates are another critical focus area. Keep tabs on failed requests, especially HTTP 5xx errors, which often point to integration problems between cloud and on-premises systems. For workflows that span multiple environments, measure transaction completion rates to ensure end-to-end functionality remains intact.
"We get Catchpoint alerts within seconds when a site is down. And we can, within three minutes, identify exactly where the issue is coming from and inform our customers and work with them." – Martin Norato Auer, VP of CX Observability Services at SAP
sbb-itb-59e1987
Configure Automated Monitoring and Alerts
Once you’ve started tracking key metrics, the next step is to automate monitoring. This helps you catch potential issues early, especially in hybrid environments, while reducing the need for constant manual oversight. By automating these processes, you can respond faster and free up your team for more critical tasks. Plus, it creates a solid foundation for improving system performance.
Configure Smart Alerts
Setting up effective alerts means distinguishing between actual problems and temporary blips. For immediate issues like CPU spikes or memory pressure, metric alerts provide near real-time updates. On the other hand, log query alerts are better for identifying patterns across multiple servers, as they allow you to analyze complex datasets using query languages.
Static thresholds, like triggering an alert when CPU usage exceeds 80%, can often lead to false alarms during predictable traffic surges. To avoid this, consider using dynamic thresholds powered by machine learning. These thresholds adapt to normal activity patterns, helping you reduce unnecessary alerts and focus on real anomalies.
It’s also important to define alert severity levels. For example, critical alerts – like resource outages – should immediately notify on-call teams via SMS. Meanwhile, lower-priority warnings can be sent through standard operational channels. Make sure to configure at least one action group per subscription, specifying notification methods and automated responses to ensure you’re capturing the most important events.
Set Up Automated Response Actions
To take automation further, link your alerts to automated response tools. For instance, automation runbooks can restart failed services immediately. If CPU usage hits a critical level, autoscale rules can automatically add more virtual machine instances to handle the load. In hybrid setups, hybrid runbook workers can execute remediation scripts directly on on-premises systems, reducing latency caused by cloud-based alerts.
For seamless integration, use webhooks to connect alerts with your existing workflows. When performance issues arise, automated actions can scale resources, restart services, or redirect traffic to healthier systems. Start with straightforward automation and gradually expand to include more complex, self-healing workflows.
Connect Alerts Across Environments
To streamline monitoring, deploy unified agents across all systems to centralize telemetry. This approach gives you a single view of both on-premises and cloud-managed resources, making it easier to identify and resolve issues that span multiple environments.
When troubleshooting, include correlation IDs in logs to track transactions across service boundaries. Enable distributed tracing to follow requests as they move between on-premises systems and cloud services. This helps pinpoint exactly where latency or failures occur. Consolidating diagnostic logs into one platform also allows you to query across all environments at once, significantly speeding up root cause analysis.
Tools like Azure Arc or AWS Systems Manager can further simplify hybrid monitoring. These services let you manage non-native VMs and Kubernetes clusters as if they were native resources, ensuring consistent monitoring policies and tagging across your entire infrastructure. By unifying your alert system, you create a strong foundation for improving overall performance and reliability.
Use AI and Predictive Analytics for Performance Optimization
AI Anomaly Detection Algorithms for Hybrid Cloud Monitoring
Once you’ve set up automated alerts, it’s time to take things to the next level. By using AI and machine learning, you can identify performance issues before they impact users, shifting from a reactive to a proactive approach. These advanced tools analyze massive amounts of telemetry data in real time, uncovering patterns that would be nearly impossible to detect manually. This makes managing performance in hybrid cloud environments far more efficient.
Set Up Anomaly Detection
AI-powered anomaly detection works by understanding what "normal" looks like in your hybrid environment and automatically flagging anything unusual. Machine learning models evolve alongside your system, adapting to changes in performance patterns. This is especially useful in hybrid clouds, where workloads frequently move between on-premises and cloud resources, creating dynamic performance baselines.
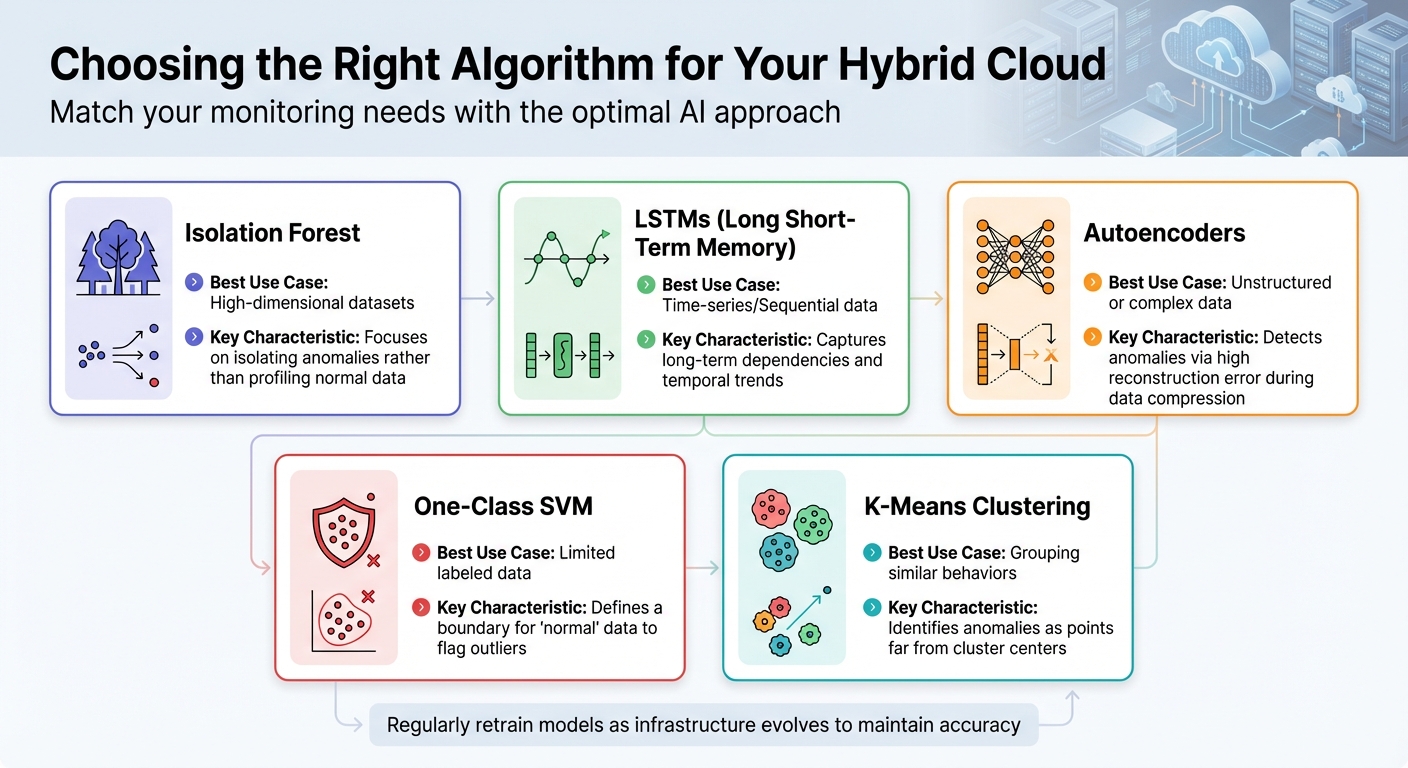
There are different types of anomalies to monitor – point, contextual, and collective – and the right algorithm depends on the situation. Here’s a quick guide:
| Algorithm | Best Use Case | Key Characteristic |
|---|---|---|
| Isolation Forest | High-dimensional datasets | Focuses on isolating anomalies rather than profiling normal data |
| LSTMs | Time-series/Sequential data | Captures long-term dependencies and temporal trends |
| Autoencoders | Unstructured or complex data | Detects anomalies via high reconstruction error during data compression |
| One-Class SVM | Limited labeled data | Defines a boundary for "normal" data to flag outliers |
| K-Means Clustering | Grouping similar behaviors | Identifies anomalies as points far from cluster centers |
For time-series data, Long Short-Term Memory (LSTM) networks work particularly well because they can capture trends over time. When dealing with high-dimensional data across multiple servers, autoencoders are a solid choice. These neural networks compress and reconstruct data, with reconstruction errors often signaling system irregularities.
One challenge in anomaly detection is data imbalance – anomalies are rare compared to normal data, which can complicate model training. To address this, some teams use Generative Adversarial Networks (GANs) to create synthetic anomaly data when real-world examples are limited. Keep an eye on metrics like Mean Time to Detection (MTTD) to measure how quickly your system identifies performance issues.
"AI-based anomaly detection is not only enhancing real-time visibility and threat response but also paving the way toward predictive, self-healing, and intelligent hybrid cloud security ecosystems." – Kavita L. Desai
Don’t forget to retrain your AI models regularly. As your infrastructure evolves – whether you’re adding new virtual machines, scaling services, or adjusting workloads – what’s considered "normal" today might look very different in the future.
Apply Predictive Analytics for Capacity Planning
Predictive analytics takes capacity planning to a new level by analyzing historical usage patterns to anticipate future resource needs. This shifts planning from reactive guesswork to a more proactive, data-driven process.
Start by centralizing data collection across your hybrid environment. Aggregate logs and metrics from on-premises systems, private clouds, and public cloud platforms into a unified data repository. This comprehensive view allows machine learning models to identify patterns and relationships between workloads and resource consumption.
"Predictive analytics can also analyze historical data and usage patterns to automatically anticipate resource needs to scale on-premise and cloud resources." – Red Hat
For example, if your models detect consistent spikes in CPU usage during specific times, they can recommend scaling resources in advance. Combine these insights with automated resource allocation to dynamically distribute workloads across the most cost-effective environments in your hybrid setup.
Before diving into AI-driven capacity planning, address any technical debt in your infrastructure. Legacy systems and outdated dependencies can create bottlenecks when you introduce AI workloads. For new deployments, consider starting fresh with a modernized infrastructure that supports long-term scalability.
"AI-powered predictive analytics tools are always learning. This means that they adapt and refine their predictions over time so they are always up-to-date." – DataBank
To keep costs under control as you scale, align your capacity planning with FinOps principles. Predictive analytics can help automate governance decisions, ensuring you optimize your cloud investments even when deploying resource-heavy AI workloads.
Review and Update Your Monitoring Strategy
AI and predictive tools aren’t a "set it and forget it" solution. As your hybrid environment evolves – whether you’re scaling infrastructure, adding services, or shifting workloads – your monitoring strategy needs to keep pace.
Regularly audit your data collection practices. Stop gathering unnecessary data and adjust retention periods to reduce costs without sacrificing compliance or root cause analysis capabilities. Fine-tune alert routing to ensure critical notifications reach the right teams and that severity levels align with your current operational priorities.
"As your environments scale, these procedures must continually be fine-tuned so that your team can quickly remediate issues and troubleshoot with precision." – Casey Wopat, Senior Product Marketing Manager, NetApp
Iterative testing is key. Validate that your monitoring data and alert thresholds align with actual performance goals. As your business needs change, new monitoring gaps may emerge. Regular reviews help you identify and address these gaps before they affect users. Update performance baselines to reflect the latest operational patterns, ensuring AI models continue to learn from accurate, up-to-date data.
Conclusion
This guide has highlighted the importance of unified visibility, thorough metric tracking, smart automation, and AI-powered tools in optimizing hybrid cloud environments. A centralized monitoring system bridges the gap between on-premises and cloud setups, cutting down detection and resolution times. Take Pine Labs, for instance – they’ve already seen a 15%–20% improvement in these areas through unified observability, with projections to hit 40%–50% as their systems become more advanced [1].
Focusing on core metrics like compute, storage, and network is critical since these directly influence user experience. It’s also essential to monitor network boundaries, where issues like latency and packet loss are more likely to arise during transitions between environments.
However, metrics alone aren’t enough – proactive measures are key. Automation can significantly reduce downtime and optimize resources. For example, the Falkland Islands Government slashed website downtime by 99% and trimmed its cloud expenses by 30% with automated alerting and resource management. Similarly, Nodecraft achieved a sixfold improvement in troubleshooting speed, cutting its mean time to resolution from three minutes to just 30 seconds, thanks to per-second metric visibility [2].
AI and predictive analytics take monitoring to the next level by setting performance benchmarks, identifying anomalies, and forecasting capacity needs before they become problems. Codyas, a technology firm, managed to reduce its monitoring staff by 67% while lowering operational costs by 46%, proving how efficient tools can enhance performance without compromising visibility [2].
To sum it up, build a strategy around unified visibility, focus on metrics that directly impact users, and harness the power of automation and AI. Make sure to adapt your approach as your infrastructure evolves. And for dependable hosting and server management, consider Serverion’s services.
[1] SolarWinds Blog, 2025
[2] Netdata Case Studies, 2023
FAQs
What are the advantages of using AI for monitoring hybrid cloud performance?
Using AI to keep tabs on hybrid cloud performance comes with some major perks. For starters, AI-powered tools provide real-time insights and predictive analytics, helping IT teams spot and fix potential issues before they turn into bigger problems. This kind of proactive monitoring minimizes downtime and keeps operations running smoothly, even in the most complex hybrid setups.
Another big win is how AI handles data correlation. By analyzing data from multiple sources, it gives IT teams a complete picture of system health. This not only boosts performance but also helps allocate resources more effectively and supports smarter decision-making. Plus, by automating routine tasks and quickly flagging anomalies, AI-driven tools save time and improve efficiency – making them a game-changer for managing hybrid cloud environments.
How can I choose the best monitoring platform for my hybrid cloud environment?
When choosing a monitoring platform for your hybrid cloud, it’s crucial to focus on features that match your infrastructure requirements.
Start with visibility. The platform should offer a clear view of your entire setup, covering both on-premises systems and cloud environments. Seamless integration with major cloud providers like AWS, Azure, and Google Cloud is a must.
Next, consider metrics tracking and anomaly detection. The platform should monitor key performance indicators across all layers of your infrastructure, identify unusual behaviors, and correlate data to simplify the troubleshooting process.
Deployment flexibility is another important factor. Whether you prefer an agent-based or agentless approach, the tool should easily adapt to your existing observability framework.
Lastly, look for unified dashboards. A centralized interface can make it easier to monitor and manage your hybrid cloud environment effectively.
By weighing these factors, you’ll be better equipped to find a monitoring platform that fits the scale and complexity of your infrastructure.
What metrics are essential for monitoring hybrid cloud performance?
To keep your hybrid cloud running smoothly, it’s essential to monitor key metrics that shed light on the performance and reliability of your applications and infrastructure across both on-premises systems and cloud platforms.
Some of the most important metrics to watch include availability, latency, resource usage (like CPU, memory, and storage), error rates, and response times. Don’t overlook network performance, especially the connectivity between your environments. Setting up alerts for critical thresholds ensures you can quickly spot and fix any issues before they grow into bigger problems.
To gain a clearer picture, link metrics from different layers – such as applications, servers, and networks. This correlation helps you identify bottlenecks and address performance hiccups as they happen. Taking this thorough approach helps your hybrid cloud stay reliable and efficient.


