
Ultimate Guide to Multi-Cloud Load Balancing Performance
Multi-cloud load balancing ensures your applications remain fast, reliable, and accessible by distributing traffic across multiple cloud providers and virtual private servers like AWS, Azure, and Google Cloud. This approach improves performance, minimizes downtime, and handles traffic spikes seamlessly. Unlike single-cloud solutions, multi-cloud load balancers operate globally, leveraging software-defined systems for flexibility and scalability.
Key Takeaways:
- Global Traffic Distribution: Routes users to the nearest or healthiest server pool using Global Server Load Balancing (GSLB).
- Reduced Latency: Smart routing drops latency significantly, e.g., from 230 ms to 123 ms for a German user accessing a U.S. server.
- Failover Mechanisms: Automated health checks and traffic isolation prevent cascading failures during outages.
- Traffic Routing Methods: Includes latency-based, geographic, load-aware, and health-based approaches.
- Security: Features like Anycast, DDoS protection, and SSL/TLS offloading safeguard traffic.
Multi-cloud load balancing is crucial for modern IT setups, ensuring high availability and optimal performance across distributed systems. Below, we dive into its architecture, challenges, and best practices for implementation.
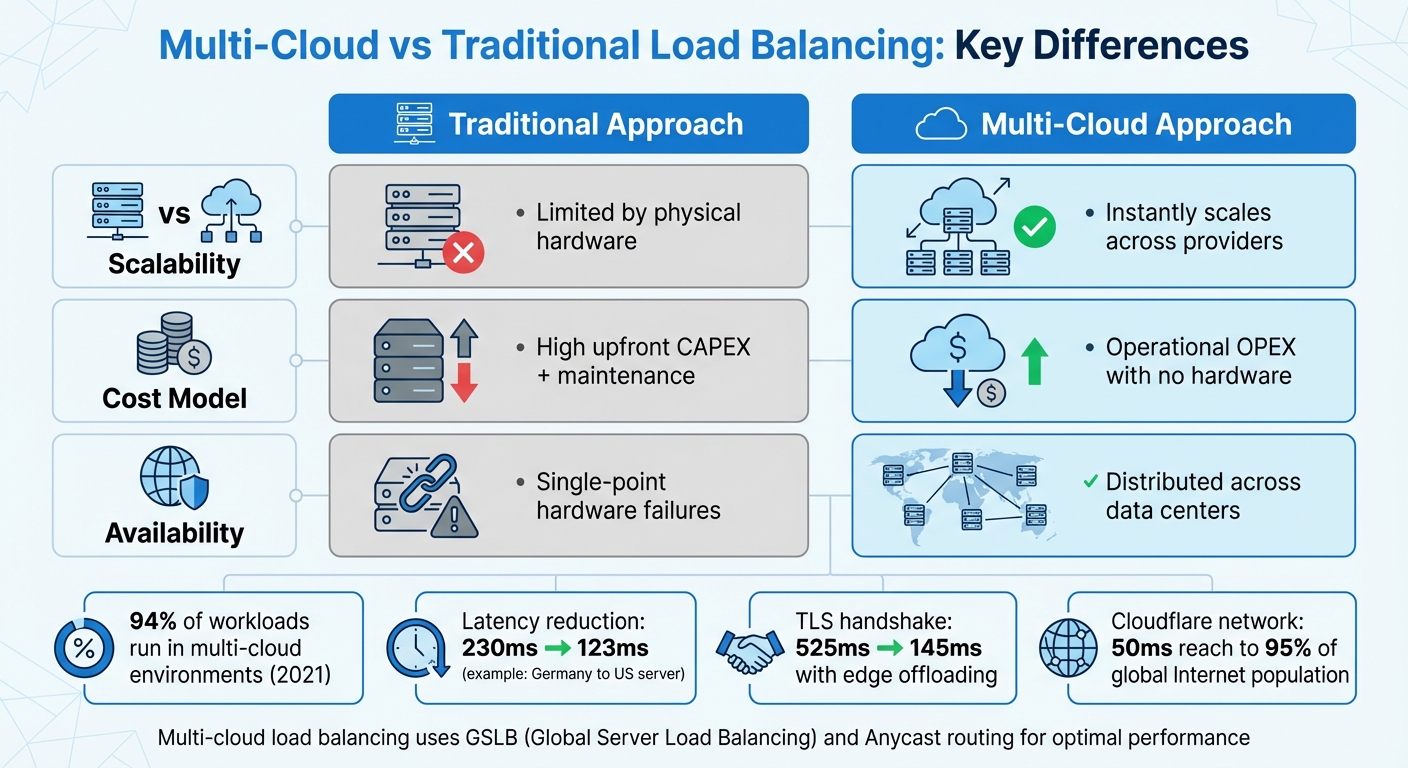
Multi-Cloud vs Traditional Load Balancing: Key Differences
Future Proof Your Load Balancing Strategy for Use in Multi-Cloud and Hybrid Cloud
sbb-itb-59e1987
Multi-Cloud Load Balancing Architecture
Multi-cloud setups depend on Global Server Load Balancing (GSLB) to distribute traffic across virtual server pools hosted by different cloud providers in various regions. Unlike traditional hardware-based systems tied to a single data center, GSLB operates independently of specific infrastructures, making it ideal for environments spread across platforms like AWS, Azure, and Google Cloud.
At the heart of this architecture is a global transit layer, which centrally manages network policies, routing, and security. Integrated health checks monitor performance, triggering automated failovers when needed. Together, these elements – global load balancing, routing configurations, and failover mechanisms – ensure the reliability of multi-cloud systems.
Global Load Balancers and Anycast
Global load balancers act as "load balancers of load balancers", directing traffic to regional services based on factors like health, capacity, and proximity. A key component of this system is Anycast routing, which uses a single IP address advertised from multiple geographic locations via Border Gateway Protocol (BGP). When users connect, BGP routes their traffic to the closest data center based on network topology.
"Anycast fundamentally works: user traffic is drawn to the closest data center advertising the prefix the user is trying to connect to, as determined by Border Gateway Protocol." – David Tuber, Cloudflare
With Anycast, a static global IP can instantly redirect traffic to the nearest healthy data center. If one data center experiences issues, BGP route withdrawal ensures traffic is automatically rerouted to the next closest location. For example, Google Cloud employs this method across more than 80 edge locations, using a "Waterfall by Region" algorithm that considers proximity, load, and capacity to optimize traffic flow.
An example of this in action occurred in August 2023, when Cloudflare’s Ashburn, Virginia (IAD02) data center faced hardware issues. Their "Duomog" system seamlessly shifted traffic to eight other healthy subsections within the region, maintaining 100% uptime without manual intervention. This highlights how Anycast-based systems can respond to failures in real time, far surpassing the speed of traditional DNS failover methods.
Active-Active vs. Active-Passive Configurations
Multi-cloud systems often use either active-active or active-passive configurations, each with its own strengths.
- Active-active configurations: In this setup, all regions handle live traffic simultaneously, maximizing resource utilization and improving response times. This approach is ideal for systems that prioritize performance and redundancy.
- Active-passive configurations: Here, traffic is directed to a primary active pool, with a secondary passive pool on standby for failover. While this setup may lead to slower failovers and underutilized standby resources, it simplifies management and reduces operational costs.
For instance, Big Cartel uses an active-passive strategy. Their CDN, Fastly, pulls data from Backblaze B2 as the primary source, with Amazon S3 serving as the automated failover target. This ensures uninterrupted service during outages while keeping costs manageable.
These configurations, combined with intelligent failover mechanisms, further strengthen system resilience.
Cross-Cloud Failover Mechanisms
Effective failover strategies depend on real-time health monitoring and automated capacity adjustments. These mechanisms ensure that traffic is only routed to healthy endpoints, maintaining performance and minimizing latency during outages.
Some systems go a step further by using Traffic Predictors to forecast potential issues and pre-configure failover policies. For example, Cloudflare simulated a regional outage by sending ping requests to hundreds of thousands of IPs and analyzing BGP shifts. Their system predicted that 99.8% of traffic would successfully reroute to Auckland, allowing engineers to preemptively adjust policies and avoid traffic surges overwhelming backup locations.
Failovers across different cloud providers are orchestrated using platform-agnostic tools like Terraform or Pulumi. These automation frameworks handle the failover process seamlessly, ensuring traffic shifts to healthy alternatives without manual intervention or DNS updates. This level of automation keeps multi-cloud systems reliable and efficient, even during unexpected disruptions.
Traffic Routing and Distribution Methods
Once you’ve set up your multi-cloud architecture, the next step is deciding how to route traffic. The routing method you choose directly affects user experience, server performance, and overall system efficiency.
Latency-Based and Geographic Routing
Latency-based routing ensures users are directed to the data center with the lowest round-trip time (RTT). By measuring network latency between user IP ranges and available endpoints, this method aims to provide the fastest response times possible. It’s a go-to choice for applications where speed is critical, such as financial trading platforms or real-time gaming.
Geographic routing, on the other hand, focuses on the user’s physical location. It routes traffic to the nearest point of presence based on the origin of the DNS query. Unlike latency-based routing, which measures network performance, geographic routing prioritizes proximity. This method is particularly useful for meeting data sovereignty requirements or delivering content tailored to specific regions.
To further reduce delays, edge termination plays a key role. By offloading TCP and SSL/TLS connections at the network edge, connection times are significantly shortened. For example, Google Cloud reports that using an external Application Load Balancer can reduce observed latency for a user in Germany accessing a US-based server from 230 ms to 123 ms. Similarly, edge SSL offloading cuts TLS handshake latency from 525 ms to 201 ms – and even down to 145 ms with HTTP/2.
"The external Application Load Balancer significantly reduces the additional latency for a TLS handshake (typically 1–2 extra roundtrips). This is because the external Application Load Balancer uses SSL offloading, and only the latency to the edge PoP is relevant." – Google Cloud Documentation
When implementing either latency-based or geographic routing, it’s crucial to configure a fallback endpoint (often called "World") to handle traffic from unmapped IP ranges. Without this safety net, requests from unexpected locations could be dropped entirely.
While proximity-based methods improve response times, they don’t address server load. That’s where dynamic load- and health-based routing comes in.
Load-Aware and Health-Based Routing
Routing decisions must also take server capacity and health into account. Load-aware routing uses real-time metrics to distribute traffic intelligently. For example, the "Least Connection" algorithm sends traffic to the server with the fewest active connections, while "Least Response Time" picks the server with the fastest historical performance.
Health-based routing ensures that traffic only goes to servers that are operational. Automated health checks monitor endpoint availability, and if a server fails, the load balancer stops sending traffic to it. Google Cloud’s default failover threshold is 70%, meaning if fewer than 70% of endpoints are healthy, traffic starts shifting to backup servers. More aggressive setups use auto-capacity draining, setting a backend’s capacity to zero if fewer than 25% of its instances pass health checks.
For even greater resilience, some systems use preemptive overflow. If more than 50% of backends in a region are unhealthy, traffic automatically shifts to the next closest healthy region, preventing user disruptions.
In scenarios where requests vary in complexity, the "Least Outstanding Requests" algorithm can be more effective than simple connection counting. This approach considers how long requests take to process, ensuring better load distribution.
Application-Layer Routing Decisions
Beyond transport-level routing, application-layer decisions can refine traffic management. Layer 7 routing uses application-specific data – like HTTP headers, URLs, or cookies – to make more sophisticated routing decisions. This approach allows for highly targeted traffic management.
"Layer-7 load balancers make routing decisions… using application-specific data. This includes the content of the data packets, HTTP headers, URLs, and cookies." – Tata Communications
One common application-layer feature is session affinity (or "sticky sessions"). This ensures all requests from a user during a session are sent to the same backend instance, which is essential for preserving data like shopping cart contents or login states. While session affinity can override load-aware algorithms, it’s necessary for certain application logic.
Another powerful tool is weighted routing, which distributes traffic based on assigned weights. This is especially helpful during application upgrades or migrations. For instance, you could route 90% of traffic to a stable production environment while testing a new version with the remaining 10%. Assigning a weight of zero lets servers gracefully drain existing connections during maintenance without taking on new requests. Azure Traffic Manager, for example, can update routing policies within one minute, allowing for quick adjustments without downtime.
Monitoring and Optimizing Performance
Once you’ve set up routing strategies, the next step is keeping a close eye on performance to ensure everything runs smoothly across all cloud environments. Smart routing is only part of the equation – continuous monitoring is what helps you identify bottlenecks and maintain peak efficiency.
Real-Time Performance Metrics
Tracking real-time metrics is essential for understanding how your system is performing. Some of the most critical metrics include data path availability and health probe status, which verify network and server performance. For example, Azure Standard Load Balancer checks these metrics every two minutes. If data path availability falls below 90% (but remains above 25%), it triggers a "Degraded" status, signaling potential issues.
Latency metrics are another key focus. These help pinpoint exactly where slowdowns occur. Total Latency measures the end-to-end response time, while Backend Latency isolates server processing time. If Total Latency is high but Backend Latency remains normal, the issue likely lies in the network rather than the application itself. On Google Cloud, these metrics are sampled every 60 seconds, though it may take 90 to 210 seconds for data to show up in dashboards, depending on the metric.
Traffic and throughput metrics also play a crucial role. These include Request Count (requests per minute), Byte Count for ingress and egress data, and Active Connections. One often-overlooked metric is tail latency, particularly the 99th percentile (p99). While average latency might look fine, tail latency reveals the experience of the slowest 1% of users, exposing hidden performance issues. These real-time insights allow you to make quick adjustments to maintain optimal performance.
Configuration Adjustments Based on Traffic Patterns
Using these real-time metrics, you can make dynamic adjustments to resource allocation. Beyond common strategies like "Least Connection" or "Least Response Time", a Waterfall by Region approach considers factors like proximity, load, and capacity. This ensures that if one region becomes saturated, traffic automatically overflows to the next closest region with available resources.
Target tracking scaling is another useful tool. By monitoring metrics like average CPU utilization or request count per target, auto-scaling policies can adjust capacity as needed. The key is selecting metrics that rise as load increases, triggering the addition of resources to meet demand.
For more advanced setups, preemptive overflow can redirect traffic to backup regions before the primary region is completely overwhelmed. For example, if health checks reveal that more than 50% of backends are unhealthy, traffic is shifted to backup locations, even if some capacity remains in the primary region.
To avoid unnecessary alerts, configure thresholds based on averages over five-minute windows rather than reacting to brief spikes. For instance, setting an alert for less than 95% availability over five minutes helps you catch real problems without being overwhelmed by false alarms.
Automated Alerting and Issue Resolution
Automated alerts and responses are essential for maintaining high availability in multi-cloud systems. Manual monitoring often falls short in these complex environments. Automated systems combine active probes with live traffic analysis to detect issues early. Passive checks, like monitoring for 5xx errors or connection timeouts, catch logic-level failures that synthetic probes might miss.
"Load balancers are automatically instrumented to provide information about traffic, availability, and latency… therefore, load balancers often act as an excellent source of SLI metrics without the need for application instrumentation." – Google Cloud
When problems arise, automated traffic draining removes unhealthy backends from rotation. At the same time, orchestration tools like Kubernetes or cloud-native autoscaling spin up replacement instances. This self-healing process keeps your system running without human intervention.
For deeper insights in multi-cloud setups, tools like Prometheus and Grafana provide platform-agnostic observability. Cloud-native solutions, such as Google Cloud Monitoring, Azure Monitor Insights, and Cloudflare Load Balancing Analytics, offer additional options. Many organizations are moving toward unified observability with OpenTelemetry, which integrates metrics, logs, and traces from all cloud providers into a single, cohesive view.
Security and Compliance in Multi-Cloud Environments
When managing multi-cloud load balancing, security is just as important as performance and reliability. It’s not just about safeguarding traffic – it’s about ensuring consistent protection across different cloud providers while adhering to regulatory standards. Each cloud platform comes with its own security configurations, which can lead to gaps if not carefully managed. These security measures work hand-in-hand with the dynamic routing and failover mechanisms already discussed, forming a comprehensive multi-cloud strategy.
DDoS Protection and Traffic Encryption
Anycast technology is a key defense against DDoS attacks. Instead of channeling all traffic through a single point, Anycast allows the same IP address to be announced across all data centers in your network. This distributes the load during an attack, preventing bottlenecks. For instance, Cloudflare’s network operates within roughly 50 ms of 95% of the global Internet-connected population, providing broad capacity to absorb attacks.
DDoS attacks typically fall into two categories: Layer 4 attacks, which target transport layers like TCP/UDP connections, and Layer 7 attacks, which focus on application layers like HTTP requests. Layer 7 attacks are especially tricky because they mimic legitimate traffic, making them harder to detect. A robust load balancer must handle both types effectively.
SSL/TLS offloading at the load balancer level simplifies the encryption process. It handles the heavy lifting of encryption and decryption, as well as certificate management. However, ensure that your compliance needs don’t require end-to-end encryption all the way to the origin server.
Web Application Firewalls and Intrusion Prevention
A single-pass architecture is crucial for maintaining performance while layering on security. Instead of routing traffic through multiple security appliances – like a WAF, IPS, and DLP – modern security gateways inspect traffic in a single pass. This reduces latency and improves overall throughput.
"The main disadvantage [of stacking vendors] is the loss of full traffic visibility when sitting behind another vendor, which hinders many of Cloudflare’s threat intelligence powered services such as Bot Management, Rate Limiting, DDoS mitigation, & IP reputation database." – Cloudflare
Avoid stacking multiple security layers, as this can create blind spots that weaken threat detection. A WAF with full visibility into traffic patterns can better identify bots, rate-limit abusive clients, and use IP reputation databases effectively. Edge-based inspection, which filters traffic closer to its source, ensures both high performance and strong security.
These robust firewall and intrusion prevention measures also help achieve compliance with industry standards.
Compliance with Regional and Industry Standards
Adhering to standards like HIPAA, PCI DSS, and SOC2 in a multi-cloud setup requires careful management of data residency and processing locations. Your load balancer’s steering layer can enforce jurisdictional routing, ensuring client requests are handled by infrastructure within specific legal boundaries.
Data classification plays a critical role. Break your data into categories like content, operational telemetry, and personal data. Each category should have defined rules for processing locations, retention periods, and access permissions. For instance, personal data (PII) might need to stay within a specific cloud account, while aggregated telemetry can move more freely.
Localized key custody ensures encryption keys remain within their designated jurisdictions by using regional key management systems (KMS). When client geography is unclear, default to the strictest residency rule.
Tools like Infrastructure as Code (e.g., Terraform) can automate the deployment of security policies across clouds. This ensures WAF rules, rate limiting, and access controls are consistently applied. Keep data flow diagrams, processor lists, and routing rules in version control for peer-reviewed audit trails, simplifying compliance checks and verifications.
Scalability and Resource Management
Multi-cloud load balancing isn’t just about keeping systems running smoothly – it also brings flexibility in scaling and helps manage costs effectively. By dynamically adjusting resources based on traffic, it ensures that applications remain responsive during busy times while avoiding unnecessary expenses during slower periods.
Auto-Scaling Policies and Triggers
Traffic-based metrics are key to fast and efficient scaling. For instance, monitoring requests per second (RPS) allows systems to respond to demand spikes before performance issues arise. On the other hand, relying on CPU or memory usage can be slower – by the time these metrics spike, users might already notice delays.
Target tracking policies help maintain consistent performance. For example, setting a target of 70% CPU utilization ensures the autoscaler kicks in when usage exceeds this level, adding resources as needed and scaling down when demand drops. Google Cloud’s Gateway resources, for example, can handle up to 100,000,000 RPS, providing plenty of capacity for high-demand scenarios.
Properly configuring initialization periods for new virtual machines (VMs) ensures they aren’t included in scaling decisions too early. Additionally, cross-regional overflow temporarily redirects traffic until local resources are fully online. These strategies help balance performance and cost while maintaining reliability.
Cost Optimization with Dynamic Resource Allocation
Scaling is just one piece of the puzzle – efficient resource allocation is equally important for keeping costs low. Cost-based routing ensures traffic is directed to regions with the lowest delivery or bandwidth costs, making the most of every dollar spent on infrastructure.
Adjusting autoscaling triggers can also save money. For instance, setting a higher threshold, like 90% CPU utilization instead of 70%, reduces the need for maintaining costly idle capacity. Regional overflow serves as a safety net, redirecting traffic to other clouds when one region reaches its limit. This approach cuts expenses while still delivering dependable service.
| Feature | Traditional Approach | Multi-Cloud Approach |
|---|---|---|
| Scalability | Limited by physical hardware | Instantly scales across providers |
| Cost Model | High upfront CAPEX + maintenance | Operational OPEX with no hardware |
| Availability | Single-point hardware failures | Distributed across data centers |
Failover thresholds further refine cost and performance balance. Typically set at 70%, these thresholds determine when traffic shifts to backup regions. Adjusting this range between 1% and 99% lets you fine-tune how aggressively resources are used based on workload needs.
Handling Traffic Surges Across Clouds
Managing sudden traffic spikes requires smart load distribution. Waterfall algorithms prioritize filling the closest region to capacity before redirecting overflow to the next nearest region. This approach minimizes latency and avoids overloading any single cloud provider or data center.
Preemptive overflow is another safeguard. If more than 50% of backends in a region are unhealthy, traffic is redirected even if there’s still some capacity left. This avoids routing users to partially degraded systems. Capacity is only restored once at least 35% of backend instances remain stable for 60 seconds, preventing constant toggling between active and inactive states.
Traffic isolation offers additional control. In "strict" isolation mode, traffic is dropped rather than redirected to other regions. This is especially useful for latency-sensitive applications or cases where data must stay within specific jurisdictions for compliance. Software-based load balancers that work across platforms like AWS, Azure, and Google Cloud make this level of flexibility possible, ensuring smooth traffic distribution without hardware limitations.
Implementation and Deployment Guide
Setting up multi-cloud load balancing involves careful planning and precise execution. The process includes connecting various cloud environments, configuring traffic flow between them, and automating tasks to minimize manual errors.
Setting Up Multi-Cloud Integration
The first step is establishing secure connectivity between cloud providers and dedicated servers and on-premises infrastructure. This is typically done using Cloud VPN or Cloud Interconnect (Dedicated or Partner), which create secure tunnels linking the environments. Once the connection is established, deploy management agents in each region to connect the central console to distributed load balancer instances.
To secure the integration, open the necessary ports: Port 53 for DNS, Port 3009 for metrics exchange (MEP), and Port 443 for management. Define Network Endpoint Groups (NEGs) or specify site IP addresses for all resources across clouds. This allows the load balancer to identify and route traffic to specific IP:Port combinations. Additionally, configure health checks to monitor endpoint availability, ensuring traffic is only directed to healthy server pools.
Once connectivity and health monitoring are set up, the next step is to configure traffic distribution strategies.
Configuring Traffic Distribution Policies
Selecting the right distribution algorithm is key to efficient traffic management across clouds. For example:
- Waterfall by Region: This method reduces latency by filling the closest region to capacity before shifting overflow traffic to the next nearest location.
- Spray to Region: This ensures even traffic distribution across all zones.
Set failover thresholds at 70% so traffic shifts when healthy endpoints drop below this level. Enable auto-capacity draining, which triggers when fewer than 25% of member instances pass health checks. This automatically sets a backend’s capacity to zero, preventing traffic from being routed to unhealthy instances.
For more granular control, use application-layer routing (Layer 7). This allows traffic steering based on HTTP headers, cookies, or URL paths. Weighted traffic splitting is particularly useful for canary deployments – for instance, directing 95% of traffic to stable backends while testing new versions with the remaining 5%. For environments with strict compliance needs, enable "STRICT" mode to enforce traffic isolation, dropping traffic instead of allowing cross-region overflow.
Once policies are in place, automation can help streamline these configurations.
Automating Processes with APIs
Automation reduces manual errors and accelerates deployment. Tools like Terraform or the gcloud CLI can be used to programmatically manage forwarding rules, URL maps, and backend services. In containerized setups, Kubernetes-native APIs, such as the Gateway API or Multi Cluster Ingress (MCI), can handle traffic distribution across clusters. Typically, projects support up to 100 MultiClusterIngress and 100 MultiClusterService resources by default.
Deploy a Config Cluster to serve as the central control point for multi-cluster load balancing. Use APIs to set target tracking scaling policies, maintaining CPU utilization at desired levels while adapting to traffic changes. Link health checks directly to backend capacity using auto-capacity draining APIs, and configure splitBrainThresholdSeconds to avoid rapid DNS changes during temporary network issues. Standardize configurations with YAML-based service policies to ensure consistent setups across platforms like AWS, Azure, and Google Cloud.
Conclusion
Summary of Main Points
Multi-cloud load balancing relies on a flexible, software-driven approach that ensures traffic is distributed effectively across multiple providers, avoiding vendor lock-in. As businesses adopt distributed systems to handle increasing demands for performance and reliability, these methods have become indispensable.
Key strategies like Global Traffic Management (GTM) at the DNS or edge layer and Private Network Load Balancing (SLB) within specific data centers lay the groundwork for a robust multi-cloud setup. Intelligent routing techniques – such as Waterfall by Region to reduce latency or Least Outstanding Requests for handling complex tasks – help direct traffic to the fastest, most stable endpoints. Real-time health monitoring, paired with auto-capacity draining, ensures degraded resources are bypassed, while automated failover mechanisms redirect traffic when system health falls below acceptable thresholds.
Security and performance work side-by-side in these configurations. Features like edge SSL/TLS termination reduce latency during handshakes, while Layer 7 application-aware routing makes decisions based on HTTP headers, cookies, or specific URL paths. Consistent enforcement of Web Application Firewalls (WAF) and Identity and Access Management (IAM) policies across all platforms helps seal off potential vulnerabilities and maintain a secure environment.
With these principles in mind, the following steps can guide you toward building a reliable and effective multi-cloud strategy.
Next Steps for Multi-Cloud Success
To maximize the advantages of multi-cloud load balancing, consider these actionable steps:
- Use Infrastructure as Code (IaC): Tools like IaC allow you to programmatically manage forwarding rules, URL maps, and backend services. This not only reduces manual errors but also speeds up deployments from days to minutes.
- Centralize Monitoring: Implement tools that provide real-time insights into latency and resource usage across your multi-cloud setup. This visibility helps you make informed decisions and maintain system health.
- Adopt Target Tracking Scaling: Adjust capacity dynamically based on performance metrics to meet demand without over-provisioning.
- Enforce Traffic Isolation: By isolating traffic, you can prevent regional failures from cascading across your system, limiting disruptions to a single area.
With 94% of workloads running in some form of multi-cloud environment by 2021, these practices are no longer optional – they’re essential for staying competitive in today’s fast-paced digital landscape.
FAQs
How do I choose between active-active and active-passive?
When deciding between active-active and active-passive setups, it’s all about balancing efficiency, fault tolerance, and complexity.
An active-active configuration uses all servers at the same time, which boosts throughput and ensures better resilience. However, it demands more effort to manage and maintain. On the other hand, active-passive keeps one server active while the other remains on standby. This option is simpler to manage and ensures a predictable failover process.
Your organization’s priorities – whether it’s performance, ease of management, or fault tolerance – will guide the right choice for your needs.
What health check settings prevent bad failovers?
To avoid problematic failovers, set up health checks with multiple successful probe thresholds and tweak both timeout and failure thresholds. This approach ensures that only truly unhealthy backends are flagged and removed from service. Fine-tuning these settings helps keep performance steady and minimizes unnecessary interruptions.
Which metrics matter most for multi-cloud latency?
When it comes to measuring multi-cloud latency, there are a few critical metrics to keep an eye on:
- Application response time: This measures how quickly an application responds to user requests, offering a direct view of the user experience.
- Network round-trip time: This tracks the time it takes for data to travel from the source to the destination and back, highlighting potential network delays.
- Resource performance metrics: These focus on the performance of servers, databases, or other cloud resources, helping identify any bottlenecks.
Together, these metrics paint a clear picture of end-to-end latency and system responsiveness, making it easier to fine-tune performance where it matters most.


