
Best Practices for Container Observability Frameworks
Container observability helps you understand why and how issues occur in containerized systems, using metrics, logs, and traces. With containers being transient and complex, traditional monitoring often falls short. Here’s what you need to know:
- Metrics: Track container performance (e.g., CPU, memory usage).
- Logs: Aggregate container logs centrally for easier troubleshooting.
- Traces: Follow requests through microservices to find bottlenecks.
To succeed, standardize your observability setup with tools like OpenTelemetry, manage data efficiently to control costs, and integrate security practices like image scanning and runtime monitoring. These steps ensure faster issue resolution and better system reliability.
With outages costing up to $500,000 per hour, investing in observability is critical for both technical and financial health.
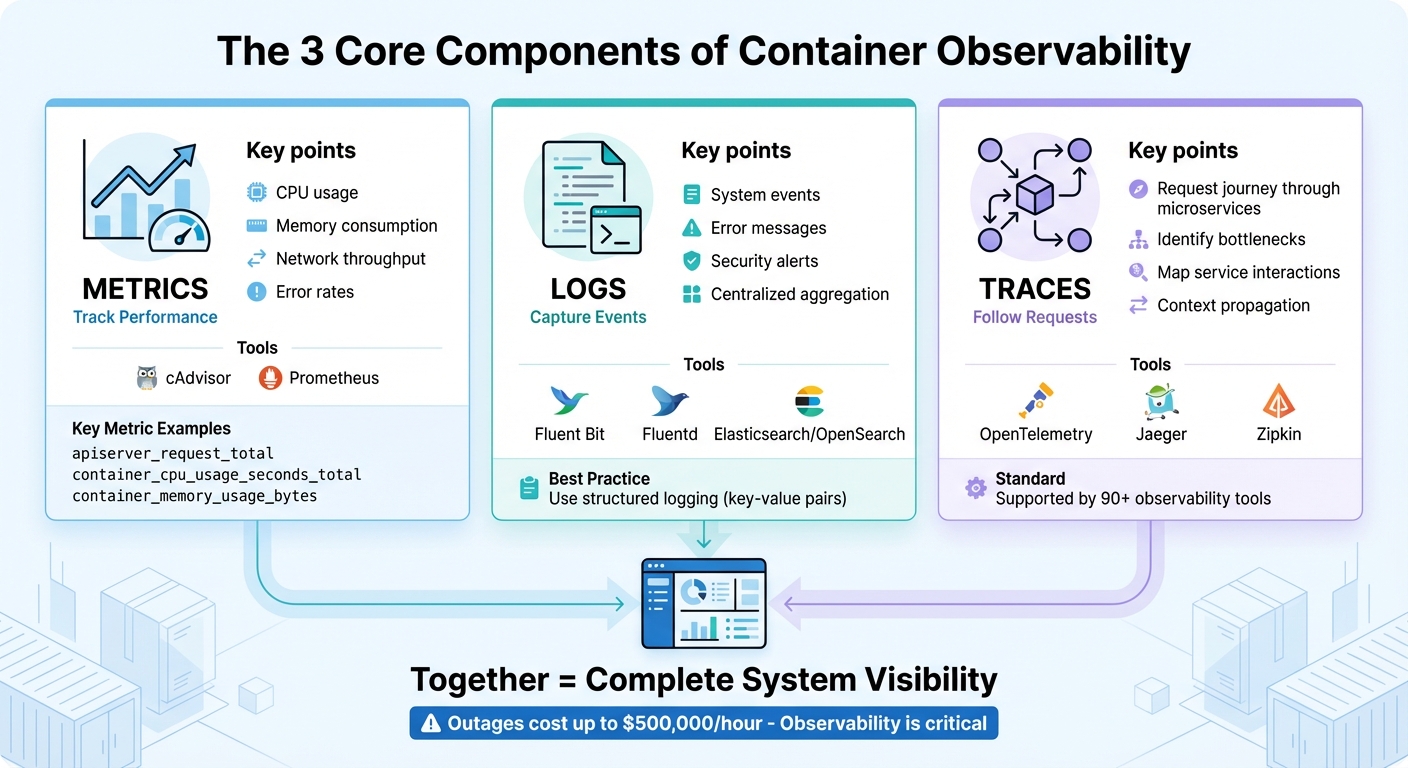
The 3 Core Components of Container Observability: Metrics, Logs, and Traces
The 3 Core Components of Observability
Collecting Metrics
Metrics provide a snapshot of container health and performance, covering areas like CPU usage, memory consumption, network throughput, and error rates. In Kubernetes environments, components such as the kube-apiserver and kubelet already expose metrics in Prometheus format through /metrics endpoints, making them easy to collect.
For container-level metrics like CPU, memory, and network usage, cAdvisor is a go-to tool. It offers data via the /metrics/cadvisor endpoint, which tools like Prometheus can scrape regularly. Prometheus stores this time-series data for analysis and alerting. To optimize performance, use recording rules to pre-compute complex queries, minimizing resource demands.
It’s essential to limit labels to critical dimensions – like namespace, pod name, and service type – to avoid high cardinality issues that can overwhelm your system. Key metrics to monitor include apiserver_request_total for API server load, container_cpu_usage_seconds_total for CPU usage, and container_memory_usage_bytes to detect memory leaks before they escalate into outages.
Once you’ve got metrics under control, the next step is centralizing your logs for a more complete picture.
Centralized Logging
Centralized logs capture system events, errors, and security alerts in one place. Since container logs are temporary by nature, aggregating them in a central location is essential.
To achieve this, deploy logging agents like Fluent Bit, which is lightweight, or Fluentd, which offers advanced routing capabilities. These agents can tail logs from /var/log and forward them to platforms such as Elasticsearch, OpenSearch, or CloudWatch for indexing and search.
Using structured logging – where log elements are formatted as key-value pairs – makes it much easier to parse, filter, and visualize logs compared to plain text. Additionally, always enable log rotation for /var/log to prevent disk space from filling up unexpectedly, a common issue that can crash nodes. Proper log management not only speeds up incident response but also helps lower Mean Time to Recovery (MTTR).
To complete the observability trifecta, integrate distributed tracing to map how requests flow through your system.
Distributed Tracing
Traces allow you to follow a request’s journey through your microservices. While metrics highlight issues like high response times and logs show specific errors, tracing pinpoints the exact bottleneck in your distributed system. Each "span" in a trace represents an operation, and together, they create a detailed map of service interactions.
OpenTelemetry is now the go-to standard for distributed tracing, supported by over 90 observability tools. Starting with Kubernetes 1.35, spans can be exported directly using the OpenTelemetry Protocol (OTLP) via built-in gRPC exporters. Tools like Jaeger and Zipkin can process these traces, helping you visualize latency patterns and identify inefficiencies such as slow database queries or poorly optimized API calls.
One of the most powerful aspects of tracing is context propagation – a method that ensures a unique identifier follows each request across all service boundaries. This links metrics, logs, and traces into a cohesive system, making it easier to pinpoint root causes quickly. By connecting these observability components, you can dramatically reduce MTTR and streamline incident resolution.
AWS re:Invent 2023 – Best practices for container observability (COP319)
Standardizing Your Observability Framework
Once you’ve set up the core components of observability, the next step is to standardize your practices. This ensures your data remains consistent and easy to interpret across your entire container environment.
Using OpenTelemetry Standards
OpenTelemetry (OTel) has become the go-to standard for container observability, supported by over 90 vendors. It offers a unified, vendor-neutral framework for generating, collecting, and exporting traces, metrics, and logs. This eliminates the need for multiple proprietary agents and ensures you retain ownership of your data.
"You own the data that you generate. There’s no vendor lock-in." – OpenTelemetry Documentation
The strength of OpenTelemetry lies in its semantic conventions, which bring uniformity to naming conventions across different codebases and platforms. For instance, container metrics like container.uptime (in seconds), container.cpu.usage (as a fraction of allocatable CPUs), and container.memory.working_set follow predictable patterns. These metrics can be seamlessly integrated with backends like Prometheus, Jaeger, or other commercial platforms.
To make the most of OpenTelemetry, initialize it at the very start of your application. This ensures all subsequent library calls are properly instrumented. Additionally, deploying a centralized OpenTelemetry Collector allows you to batch, compress, and transform telemetry data before sending it to your backend. This approach not only reduces system overhead but also provides the flexibility to switch observability platforms without reworking your application instrumentation.
Consistent Tagging and Metadata
Standardizing metadata is key to turning raw telemetry into actionable insights. Using consistent labels like traceID, pod_name, node_name, and namespace helps you link different telemetry types. For example, if you notice a latency spike, these labels let you trace the issue back to a specific container and determine whether it’s hitting resource limits.
Adopting Prometheus naming conventions – such as operator_name_entity_metric_name – can further enhance consistency across resources. However, be mindful of label cardinality. Avoid high-cardinality dimensions like user IDs or email addresses, as they can inflate storage costs and overwhelm your system with excessive unique time series.
By aligning with OpenTelemetry’s semantic conventions early on, you ensure your data remains clear and searchable, reducing confusion during troubleshooting or incident response. Once your telemetry is standardized, you’re ready to deploy a reliable hosting infrastructure.
Using Serverion Hosting Solutions
With your observability framework in place, Serverion’s VPS and Dedicated Servers offer the reliability needed to host OpenTelemetry Collectors at scale. For node-specific telemetry, deploy Collectors using a "Daemonset" pattern on Serverion VPS instances. If you’re aggregating data across an entire cluster, use a "Deployment" pattern on Dedicated Servers to centralize processing and avoid duplication.
To secure your setup, implement Role-Based Access Control (RBAC) to limit Collector privileges to only what’s necessary. Use precise volume mount permissions and secure sensitive data with robust configuration management. Additionally, monitor the health of your observability infrastructure by tracking the Collector’s internal telemetry and setting alerts for CPU and memory usage. This helps maintain stability, even under heavy loads.
If a single hosting instance reaches its resource limits, you can scale horizontally by deploying multiple Collectors in a load-balanced configuration across Serverion’s global data centers. With Serverion handling the heavy lifting, your observability framework can grow effortlessly alongside your containerized applications.
Setting Up Monitoring and Alerting Systems
Setting up monitoring and alerting systems is essential to catch potential issues early, before they turn into bigger problems. A well-thought-out monitoring setup connects your standardized framework with actionable insights, enabling your team to identify and resolve issues efficiently.
Defining SLOs and SLIs
Service Level Indicators (SLIs) are the metrics you track, while Service Level Objectives (SLOs) are the goals you set for those metrics. Focus on metrics that directly affect user experience, such as API server latency, node health, and pod readiness.
Set SLOs with severity-based targets. For example:
- Trigger critical alerts within 5 minutes for conditions that could lead to significant service disruptions.
- Trigger warning alerts within 60 minutes for less urgent issues.
"Reserve critical level alerts only for reporting conditions that may lead to loss of data or inability to deliver service for the cluster as a whole." – Operator Observability Best Practices
To manage large-scale environments, use Prometheus recording rules to pre-compute frequently used expressions. This is especially useful when tracking SLOs across hundreds or thousands of containers. Every alert tied to an SLO should include a runbook_url annotation, providing step-by-step resolution guidance and minimizing downtime during incidents.
Configuring Actionable Alerts
Actionable alerts focus on symptoms that truly impact your system or users, rather than just flagging unusual metric values. For instance, avoid triggering alerts for minor metric fluctuations that don’t affect functionality. Instead, prioritize conditions like:
- Sustained high latency
- Repeated pod restarts
- Resource exhaustion
Leverage PromQL’s predict_linear function to create dynamic thresholds, allowing your team to predict and address potential issues before they escalate. Static thresholds often miss the mark, while predictive alerts give your team a head start.
When configuring alerts, set a 15-minute duration to filter out transient issues. Include key details like cluster, namespace, and pod information, along with dashboard links for quick context.
Monitoring Resource Utilization
To ensure smooth operations, monitor resource usage across different system layers:
- Control plane: Track components like the API server and etcd.
- Cluster state: Watch for node status and pod scheduling issues.
- Container metrics: Keep an eye on CPU, memory, and network I/O.
For example, monitor kube_pod_container_status_restarts_total to spot crashlooping containers. A common threshold is more than three restarts within 15 minutes. Similarly, track the size of the etcd database (apiserver_storage_db_total_size_in_bytes), as exceeding its limits can jeopardize the entire control plane.
Other key areas to monitor include pending pods and scheduling failures, which often point to resource shortages or misconfigured requests. When containers are terminated due to OOMKilled events, set up Info-level alerts to flag resource limit breaches early, preventing widespread failures.
Finally, regularly evaluate the performance of your alerts. Analyze metrics like alert frequency, resolution times, and false positive rates. This helps refine your rules so they stay effective as your environment evolves.
sbb-itb-59e1987
Adding Security to Your Observability Framework
When monitoring containerized applications, security isn’t just a nice-to-have – it’s an absolute necessity. By embedding security directly into your observability framework, you can leverage the same tools used for performance tracking to identify potential threats. But this only works if everything is set up correctly from the start.
Image Scanning and Vulnerability Management
Incorporating image scanning into your CI/CD pipeline is a proactive step to catch vulnerabilities early in the development process. Inline scanning ensures that sensitive data stays private by scanning images locally and only sending metadata to the scanning tool. This approach blocks unapproved images before they can cause issues.
"Image scanning is the first line of defense in your Secure DevOps workflow." – Sysdig
Expand this protection by implementing registry-level scanning to verify all images, including third-party ones, before deployment. Use Kubernetes admission controllers to block images that haven’t been scanned or don’t meet compliance standards. Since new vulnerabilities (CVEs) are constantly emerging, it’s crucial to rescan images in production regularly to address "day-zero" threats.
Focus on fixing vulnerabilities that have active exploits in your production environment. To maintain consistency, tag your images with immutable identifiers like SHA256 digests instead of mutable tags like :latest.
Runtime Security Monitoring
Runtime monitoring adds another layer of protection by keeping an eye on container behavior. For example, monitoring kernel system calls can help you detect unusual file access or network activity. Establishing baselines makes it easier to spot deviations quickly.
Centralizing stdout and stderr logs from container runtimes creates a chronological record of security events that remains available even after a container shuts down. To minimize risks, configure containers with randomized UIDs to block privilege escalation. Additionally, apply seccomp or AppArmor profiles, drop unnecessary Linux capabilities, and set CPU and memory limits to prevent resource exhaustion attacks.
DDoS Protection and Logging with Serverion
While runtime monitoring secures internal processes, protecting against external threats like DDoS attacks is equally critical. Serverion’s hosting infrastructure offers built-in DDoS protection through its globally distributed data centers. This setup absorbs volumetric attacks before they reach your applications. Features like rate limiting and geo-blocking add another layer of defense at the application level.
Serverion’s logging capabilities can integrate seamlessly with your observability framework, capturing security events across your entire stack – from cloud configurations to individual containers. By establishing traffic baselines, you can differentiate between legitimate spikes in usage and early signs of bot-driven attacks. Last year alone, nearly 9 million DDoS attacks targeted critical services worldwide.
"The key challenge is distinguishing between legitimate users and malicious bots, particularly when both are producing high volumes of incoming traffic." – SecurityScorecard
To further secure your logging setup, follow the principle of least privilege. Use Role-Based Access Control (RBAC) to limit observability tools to only the directories they need. For server-like components, enable bearer token or basic authentication and restrict the IP addresses they operate on. Additionally, monitor the performance of your observability tools – such as CPU, memory, and throughput – to ensure they don’t become overwhelmed during an attack.
Managing Scale and Cost
To keep systems efficient, managing scale and costs is just as important as maintaining robust observability and security practices. As container usage grows, so does the volume of observability data. For instance, tracking a single metric like node_filesystem_avail across 10,000 nodes creates about 100,000 time series – manageable for many systems. But introduce a high-cardinality label, like user IDs, and that number can skyrocket to 100 million time series, which is far beyond what standard Prometheus setups can handle. The challenge lies in controlling cardinality while still retaining critical insights.
Managing High Cardinality Data
High cardinality occurs when metrics include labels with an unlimited range of values, such as user IDs, email addresses, or dynamic pod names. Each unique combination of labels generates a new time series, consuming significant resources.
"Each labelset is an additional time series that has RAM, CPU, disk, and network costs. Usually the overhead is negligible, but in scenarios with lots of metrics and hundreds of labelsets across hundreds of servers, this can add up quickly." – Prometheus Documentation
To tackle this, aggregation becomes your best ally. Recording rules can pre-compute complex queries, creating new, less resource-intensive time series. For example, a rule like sum without(instance, namespace, pod) removes high-cardinality labels while preserving meaningful data. Additionally, during ingestion, you can use metric_relabel_configs to drop unnecessary labels such as instance or pod – especially useful for long-term trend analysis. For high-volume metrics or distributed tracing, ingestion sampling is another effective strategy. This method captures 100% of critical error traces but reduces normal trace volume to, say, 1%, ensuring statistical relevance without overwhelming your system.
Keep most metrics at a cardinality of 10 or lower. For metrics that exceed this, limit them to just a few across your entire environment. Avoid using labels for procedurally generated values, and instead, export Unix timestamps for events rather than "time since" counters to minimize constant updates. These practices help maintain efficient observability without overloading your system.
Data Retention Policies
Not all observability data needs to be stored the same way. Using tiered storage can balance costs while keeping the right data accessible. Here’s a common approach:
- Hot Path: Store real-time data for alerts and live dashboards in systems like Kafka or stream processors.
- Warm Path: Use time-series databases like Prometheus for near real-time analytics and troubleshooting.
- Cold Path: Archive long-term compliance and audit data in data lakes or storage like S3.
For example, default Istio setups use a 6-hour retention window for local Prometheus instances to reduce the storage burden of high-cardinality labels. High-resolution data can be retained for immediate troubleshooting, while aggregated, low-cardinality data is stored for historical analysis. This strategy not only cuts storage costs by up to 40% but also improves query performance. Observability budgets often account for about 3% of overall infrastructure costs, so optimizing retention policies can have a direct impact on financial efficiency.
Scaling with eBPF Tools
For even greater optimization, consider kernel-level monitoring with eBPF-based tools like groundcover. These tools gather data directly from the Linux kernel, offering detailed insights into network traffic, disk I/O, and inter-process communication – all with minimal resource usage. The best part? They work transparently, requiring no changes to your application code.
Unlike traditional instrumentation, which involves integrating libraries and can add overhead, eBPF operates at the kernel level, keeping syscall overhead low. This makes it ideal for production environments where every CPU cycle counts. To further reduce resource consumption, tools like the OpenTelemetry batch processor can group data into chunks – such as 500 items or every 30 seconds – before sending it. This approach minimizes the number of network calls, lightening the load on your observability framework while maximizing efficiency.
Conclusion
Summary of Best Practices
Establishing a strong container observability framework is key to maintaining smooth application performance. This framework relies on three core components – metrics, logs, and traces – working together to provide a complete view of your cluster’s inner workings.
Adopting standards like OpenTelemetry and setting up intelligent alerts helps teams focus on what truly matters. Critical alerts should trigger within about 5 minutes and demand immediate attention for major incidents only. On the security side, your observability framework should track failed login attempts, unauthorized changes, and unusual network activity, alongside traditional performance data. To manage costs effectively, strategies like data retention policies, cardinality control, and tools such as eBPF are essential. With outages potentially costing up to $500,000 per hour, these practices safeguard both your operations and your finances.
"Like security, observability should not be an afterthought to your development or operations. The best practice is to put observability early in your planning." – AWS Observability Best Practices
Of course, these best practices thrive on a stable and reliable hosting platform.
How Serverion Supports Observability
Serverion enhances observability efforts by offering dependable and secure hosting solutions. To make the most of these best practices, your observability tools need a strong infrastructure. Serverion’s hosting services provide the backbone for tools like Prometheus scrapers and Fluent Bit aggregators, while also delivering DDoS protection and secure logging to maintain top-notch performance.
With access to critical host signals and journald logs, debugging cluster issues becomes faster and more efficient. The built-in DDoS protection and detailed logging create an added layer of security, enabling real-time correlation of network attacks with application performance. Whether you’re using VPS, dedicated servers, or AI GPU infrastructure, Serverion’s global data centers ensure your monitoring tools remain operational – even during system failures. After all, high-availability hosting is the foundation that allows observability tools to truly shine.
FAQs
What are the main advantages of using OpenTelemetry for monitoring containers?
OpenTelemetry is an open-source framework that makes container observability more straightforward by standardizing how traces, metrics, and logs are collected. Its vendor-neutral approach means you’re not tied to a specific provider, giving you the freedom to choose or switch between different backend systems without hassle.
With OpenTelemetry, you only need to instrument your applications once. From there, you can effortlessly export data to any observability platform. This consistency simplifies monitoring, streamlines troubleshooting, and ensures your observability setup can adapt to future changes.
What are the best ways to manage high-cardinality metrics for better system performance?
Managing metrics with high cardinality is key to keeping your container observability framework both fast and cost-effective. High cardinality arises when metrics include labels with numerous unique values (like instance, pod, or namespace). This can overwhelm storage systems, increase resource demands, and hurt performance – especially in environments like Kubernetes or Istio.
Here are some practical ways to handle high-cardinality metrics:
- Limit labels to the essentials: Stick to labels that are critical for troubleshooting. Avoid using high-variance labels such as container IDs or request IDs, as they can quickly balloon the number of unique metrics.
- Aggregate metrics early: Tools like Prometheus recording rules can help by pre-computing metrics at a higher level. This reduces the volume of raw time series data you need to store.
- Simplify your metrics: Drop or rewrite unnecessary labels during ingestion. You can also use more efficient metric types, such as counters or histograms with a limited number of buckets.
By streamlining and aggregating your metrics, you’ll maintain a scalable and efficient observability framework. This is especially important when running workloads on robust infrastructures like those offered by Serverion.
What are the key security practices for a container observability framework?
To keep a container observability framework secure, it’s important to view telemetry data – such as metrics, logs, and traces – not only as a tool for spotting threats but also as an asset that requires protection. Incorporating security measures throughout your observability pipeline helps identify anomalies early while also safeguarding the system that monitors your containers.
Here are some key steps to consider:
- Use verified and scanned container images: This helps catch vulnerabilities before deployment, reducing the risk of introducing security flaws.
- Run containers with limited privileges: Avoid granting root access and enforce read-only file systems to minimize potential damage from breaches.
- Secure secrets like API keys and tokens: Store sensitive information in a dedicated secret management tool and inject it securely at runtime to prevent exposure.
- Encrypt telemetry data: Use TLS for data in transit and secure storage methods for data at rest to ensure confidentiality.
- Enforce strict access controls: Implement role-based access control (RBAC) to restrict who can view and manage observability data.
By following these practices, especially when paired with reliable infrastructures like Serverion’s hosting solutions, you can build a secure and dependable framework that protects your containerized environments.


