
Checklist for SIEM-Endpoint Security Setup
Integrating SIEM with endpoint security tools is essential for creating a centralized, efficient, and responsive security system. This guide breaks down the process into six steps, helping you streamline your setup, reduce alert fatigue, and improve threat detection. Here’s a quick summary of the steps covered:
- Define Objectives: Set clear goals for the integration, focusing on business, security, and operational needs. Avoid collecting unnecessary data.
- Assess Tools: Inventory your existing security tools and ensure compatibility with your SIEM system.
- Configure Data Ingestion: Connect critical data sources like EDR logs, authentication systems, and network security logs. Standardize log formats and retention policies.
- Set Up Threat Detection: Build correlation rules and integrate threat intelligence feeds to identify and respond to threats effectively.
- Establish Governance: Implement role-based access control (RBAC) and define incident response workflows for structured threat handling.
- Validate and Optimize: Test detection accuracy, monitor performance metrics, and regularly refine your setup to ensure efficiency.
The goal is to transform scattered security data into actionable insights, enabling faster responses to threats while maintaining compliance. Whether you’re a small business or a large enterprise, following these steps will help you build a reliable and scalable security operation.
6-Step SIEM-Endpoint Security Integration Process
Configuring Kaspersky Security Center for SIEM Integration | Step-by-Step Tutorial
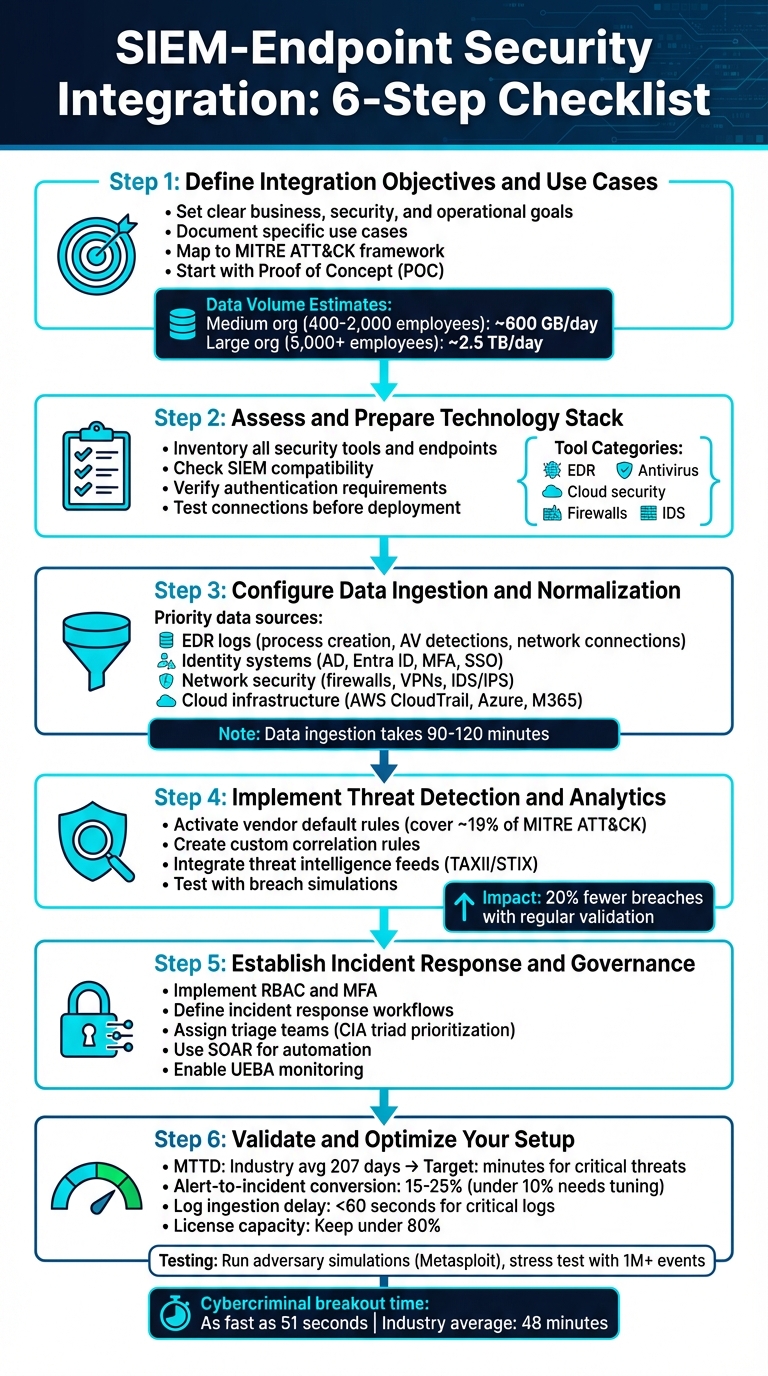
Step 1: Define Integration Objectives and Use Cases
Before connecting systems, take the time to define the purpose of your integration. Jumping into implementation without clear goals can lead to wasted resources and systems that don’t align with your needs. The Australian Signals Directorate cautions against this approach:
"The authoring agencies discourage logging for the sake of logging."
Your objectives should strike a balance between business needs, security priorities, and operational demands. Collecting data aimlessly won’t help – focus on what truly matters. Start by organizing your goals into three categories: business, security, and operational.
Identify Business and Security Objectives
Break your goals into manageable categories. For business objectives, think about reducing incident-related costs, ensuring compliance with regulations like HIPAA or Essential Eight, and boosting staff productivity. Security goals might include detecting "Living off the Land" (LOTL) threats, automating responses to incidents, and correlating data from various sources. Operational objectives could focus on reducing alert fatigue, centralizing dashboards, or simplifying forensic analysis.
Be realistic about your resources. Assign a System Owner to oversee platform changes and integration tasks. Also, consider your organization’s scale when estimating log ingestion volumes. For example, a medium-sized organization (400–2,000 employees) might generate around 600 GB of data daily, while a larger organization (over 5,000 employees) could produce up to 2.5 TB per day.
Document Key Use Cases
Once you’ve nailed down your objectives, turn them into specific, actionable use cases that fit your environment. Avoid generic scenarios – they won’t address the unique aspects of your IT setup, risk profile, or threat landscape. Examples of tailored use cases include detecting insider threats, analyzing malware, generating compliance reports, or identifying LOTL tactics. To ensure comprehensive threat coverage, map each use case to the MITRE ATT&CK framework.
Start with a Proof of Concept (POC) targeting a critical risk area to test the integration’s effectiveness before rolling it out fully. Document the purpose, volume, and analytical value of each data source. Define specific goals like compliance reporting, incident response, or threat detection to ensure your team stays focused. This approach helps avoid system overload and prioritizes high-value feeds, such as Endpoint Detection and Response (EDR) and Active Directory logs.
Step 2: Assess and Prepare Your Technology Stack
After setting your objectives, the next step is to take a close look at your technology stack. A thorough inventory of your tools and a compatibility check are essential to ensure your SIEM (Security Information and Event Management) system integrates effectively. Skipping this step can lead to integration failures, wasted resources, and frustrated teams. This process lays the groundwork for ensuring your SIEM works seamlessly with your existing systems.
Inventory Existing Tools and Systems
Start by cataloging all your security tools, endpoint devices, and systems that will feed data into your SIEM. Break down your endpoint devices by operating system – Windows, macOS, and Linux – and document the specific connectors or agents they require. Organize your tools by their function, such as:
- Endpoint Detection and Response (EDR)
- Antivirus software
- Cloud application security
- Firewalls
- Intrusion detection systems
Each of these tools ties into different SIEM event sources, influencing how data is collected and normalized.
Make sure to record technical details like IP addresses, operating system versions, and GUIDs. These can be crucial for incident investigations. If you have legacy systems, note whether they’ll need middleware or syslog forwarding for compatibility. For air-gapped networks, plan for gateway solutions to bridge the gap.
Evaluate SIEM Compatibility
With your inventory complete, the next step is to verify whether your SIEM can ingest data from all these sources. Start by checking your SIEM’s marketplace for pre-built integrations, often referred to as "Add-ons", "SmartConnectors", or "Device Support Modules (DSM)."
For example, Rapid7 offers structured integration for SentinelOne EDR, allowing data collection via API or Syslog. Similarly, Microsoft provides the "Splunk Add-on for Microsoft Security", which integrates incidents from Defender for Endpoint and Defender for Identity into Splunk using the Microsoft Graph security API.
Choose the integration model that fits your setup best. For instance:
- Use REST APIs for alerts.
- Opt for streaming APIs like Azure Event Hubs for handling large volumes of data.
Make sure to confirm authentication requirements, such as OAuth 2.0 via Microsoft Entra ID or dedicated API tokens. When setting up API connections, always create a dedicated "Service User" in your endpoint management console. This avoids disruptions if an individual admin leaves your organization.
Before diving into correlation rules, test your connections. Most SIEMs have features for validating raw log ingestion. For instance, Cisco XDR includes a "Detection Ingest Status" dashboard card to verify that logs from macOS, Windows, and Linux endpoints are being processed correctly. Ensure your endpoint logs are mapped to your SIEM’s standard schema, like the Common Information Model (CIM) or Common Event Framework (CEF), to streamline searching and reporting.
| Ingestion Method | Best For | Requirements |
|---|---|---|
| API Collection | Cloud-native tools (e.g., SentinelOne) | API Keys, Secret Tokens, Internet connectivity |
| Syslog Forwarding | Network hardware (e.g., firewalls) | Syslog server or SIEM listener port |
| Streaming API | High-volume enterprise data | Azure/AWS storage accounts, streaming setup |
| Agent-based | Servers and workstations | Local connector or agent installation |
If your SIEM lacks native integrations for certain tools, consider alternative methods like Syslog, log aggregators, or "Tail File" methods for on-premise systems. Some endpoint-to-SIEM services offer a buffer for undelivered logs – up to seven days or 80 GB per customer – ensuring critical telemetry isn’t lost during connectivity issues. This safety net gives you time to fix problems without missing key security data.
Step 3: Configure Data Ingestion and Normalization
Once you’ve ensured compatibility, the next steps involve connecting your chosen data sources and setting up normalization policies. It’s also crucial to define the technical requirements for each data source to ensure smooth integration.
Connect Key Data Sources
Start by focusing on high-priority data sources. Begin with Endpoint Detection and Response (EDR) logs, which capture vital security events like process creation, antivirus detections, network connections, DLL loads, and file changes. Then, integrate your identity and authentication systems – Active Directory Domain Controllers, Entra ID (formerly Azure AD), Multi-Factor Authentication (MFA), and Single Sign-On (SSO). These systems are essential for monitoring credential activities and detecting unauthorized access attempts.
To maintain comprehensive visibility, collect logs from all Domain Controllers. For operating systems, prioritize events from Windows Security, System, PowerShell, and Sysmon, as well as detailed logs from Linux hosts. Network security logs from firewalls, VPNs, web proxies, and Intrusion Detection/Prevention Systems (IDS/IPS) are equally important, as they reveal how threats move across your network. Don’t forget cloud infrastructure logs – connect AWS CloudTrail, Azure Audit logs, Microsoft 365’s Unified Audit Log, and application-specific logs from email systems and web servers.
For on-premises or Linux-based environments, use tools like the Azure Monitor Agent to stream logs in real-time using Syslog or Common Event Format (CEF). Be aware that data ingestion into cloud-based systems like Microsoft Sentinel typically takes 90 to 120 minutes, so plan your testing and monitoring schedules accordingly.
Once all data sources are connected, it’s time to establish formal log management policies.
Define Log Management Policies
Only log data that aligns with your organization’s risk profile. Evaluate each data source based on its analytical value and the volume of logs it generates to avoid overloading your system with unnecessary data.
To ensure consistency, map all ingested data to a common schema, such as CIM or ASIM, and standardize field names to eliminate confusion. Set retention periods based on compliance requirements. For example, some systems allow for an "analytics tier" for immediate searches and a "data lake tier" for long-term storage, which can extend up to 12 years. Filtering out irrelevant information not only reduces noise but also helps lower storage costs.
Synchronize timestamps across all data sources to enable accurate event correlation. Additionally, configure Windows Audit Policies to include Kerberos ticket auditing (both Success and Failure) on all Domain Controllers. Provide mapping hints – such as format, vendor, product, and event ID – to simplify and standardize field mappings across your system.
sbb-itb-59e1987
Step 4: Implement Threat Detection and Analytics
Turn the logs you’ve gathered into actionable insights by setting up correlation rules and incorporating threat intelligence feeds.
Configure Correlation Rules
Start by activating the default rules provided by your vendor to observe how your SIEM system reacts to the traffic patterns in your environment. Keep in mind that these preconfigured rules usually cover only about 19% of the known MITRE ATT&CK techniques. To fill the gaps, you’ll need to create custom rules tailored to your organization’s specific risks. These rules should address various attack stages, such as reconnaissance, lateral movement, and data exfiltration.
When building rules, use simple if/then logic. For example, you might correlate a Windows login event with an endpoint detection and response (EDR) process spawn that occurs within 5 to 15 minutes, which could indicate lateral movement. You can also set thresholds, such as triggering an alert if 10 failed logins are followed by a successful one. To limit unnecessary noise, group matches by entities like UserID or SourceIP so that alerts are only triggered when the activity comes from the same source.
Organizations that regularly validate their detection rules experience measurable benefits, including 20% fewer breaches. Additionally, 47% of security leaders report that testing these rules improves their mean time-to-detection. Use breach-and-attack simulations to test your rules and filter out known safe activities to reduce false positives.
Focus on creating high-priority rules for scenarios like Rogue Name Servers (e.g., detecting DNS traffic directed outside internal servers), SPAM bots (e.g., monitoring SMTP traffic from unauthorized internal systems), and alerts for generic accounts like "administrator" or "root." As Stephen Perciballi from Palo Alto Networks advises:
"My general methodology with SIEM (and any Intrusion Prevention System for that matter) is to enable everything and see what happens, and then tune back what I am not interested in."
Once your correlation rules are in place, take your detection efforts further by integrating threat intelligence feeds.
Integrate Threat Intelligence Feeds
External threat intelligence feeds can significantly enhance your detection capabilities by identifying malicious indicators, such as suspicious URLs, file hashes, or IP addresses, within your event data. These feeds are typically integrated via TAXII servers supporting the STIX format or through direct API uploads.
For Microsoft Sentinel users, be aware that the older TIP data connector will no longer collect data after April 2026. To stay ahead, migrate to the Threat Intelligence Upload Indicators API before the deadline.
Built-in analytics rules, often referred to as "TI map" rules, can automatically correlate imported threat indicators with your raw logs. For example, these rules might flag a malicious IP address from a threat feed that appears in your firewall or DNS activity logs. Fine-tune settings like polling frequency and lookback periods to maintain a balance between up-to-date intelligence and system performance. Many SIEM platforms refresh threat indicators every 7 to 10 days to ensure accuracy.
When connecting to TAXII feeds, ensure you have the correct API root URI and Collection ID as outlined in the feed’s documentation. For certain feeds, such as FS-ISAC, you may also need to add your SIEM client’s IP addresses to the provider’s allowlist to avoid connection issues. Beyond detection, automated playbooks can enrich flagged incidents with additional context from tools like VirusTotal or RiskIQ, helping analysts quickly evaluate the severity of potential threats.
Step 5: Establish Incident Response and Governance
Once your detection rules and threat feeds are active, the next step is to tighten control over SIEM access and define clear response actions. This ensures proper handling of threats and prevents unauthorized access. These governance measures build directly on the earlier steps of integration and data normalization.
Set Up Role-Based Access Control (RBAC)
With your SIEM data integrated, it’s time to restrict access using RBAC. This approach limits SIEM access to authorized users based on their specific job roles, enforcing the principle of least privilege. By doing this, you reduce the chances of accidental data exposure or misuse. To further secure access, enable multi-factor authentication (MFA) for all accounts connected to your SIEM and endpoint tools, blocking most unauthorized entry attempts.
Tailor role-based views to suit different needs. For example, executives can access high-level summaries, while technicians get detailed log data. Use OAuth 2.0 for SIEM authentication by registering it with your identity provider to manage tokens securely. Beyond the setup, incorporate User & Entity Behavior Analytics (UEBA) to monitor access patterns and ensure user activities align with their permissions. Regular access audits are essential – review user permissions, alert suppression rules, and device exclusions to identify and address any vulnerabilities early.
Define Incident Response Processes
Create detailed workflows for handling incidents, supported by comprehensive playbooks. Assign a triage team to prioritize responses based on the CIA triad (Confidentiality, Integrity, Availability). Each workload team should have a designated point of contact to receive high-priority alerts with the necessary security context for immediate action.
Your workflows should cover endpoint-specific tasks, such as isolating devices, quarantining data, and revoking compromised credentials. Use SOAR (Security Orchestration, Automation, and Response) to automate repetitive tasks, like quarantining affected systems, while enabling SecOps teams to take live remote actions for faster containment. As the Australian Signals Directorate explains:
"A SOAR platform will never replace human incident responders; however, by automating some actions involved in responding to specific events and incidents, it can allow staff to focus on the more complex and high-value problems."
Regularly review incidents to refine your response plans. Use tools that maintain detailed audit trails to verify that both automated and manual actions are effective.
For organizations relying on secure hosting, providers like Serverion offer support for these incident response and governance strategies, ensuring strong performance and security.
Step 6: Validate and Optimize Your Setup
Once you’ve established governance and configured your system, the next step is to bring your integration to life as a proactive security operation. Validation is key here. As NetWitness aptly states:
"Most SIEM programs fail for one simple reason: they collect everything, but they do not prove what they can actually detect."
This means that simply gathering data isn’t enough – you need to test how well your system detects and responds to threats. By focusing on detection accuracy and performance metrics, you can transform raw data collection into an effective security operation.
Test Detection Accuracy
Start by running adversary simulations using tools like Metasploit. These simulations should cover stages such as initial access, execution, and privilege escalation. The goal is to ensure your SIEM generates actionable alerts during real-world threat scenarios. To make this process even more effective, map each correlation rule to specific MITRE ATT&CK techniques. This will help you pinpoint coverage gaps across the attack lifecycle. Use a 0–3 scoring scale to measure detection effectiveness and identify areas for improvement.
Another critical step is to verify that the number of endpoint events matches what your SIEM ingests. Discrepancies could indicate data loss. Stress testing is also important – inject over 1 million events to evaluate how well your system handles high loads and whether dashboards remain responsive under pressure. Tools like Windows Sysinternals Sysmon can enhance visibility into system activity, complementing your EDR for deeper detection capabilities. With cybercriminals now averaging a breakout time of just 48 minutes (and as fast as 51 seconds in some cases), fine-tuning detection accuracy is more crucial than ever.
Once you’re confident in your detection capabilities, shift focus to operational performance metrics.
Review Performance Metrics
Key metrics like Mean Time to Detect (MTTD) and Mean Time to Respond (MTTR) are essential for evaluating your system’s efficiency. While the industry average MTTD is roughly 207 days, top-tier Security Operations Centers (SOCs) aim to reduce detection times to just minutes for critical threats. Similarly, your alert-to-incident conversion rate should fall between 15% and 25%. If it’s under 10%, it’s a clear sign that your system needs tuning.
Real-time response also depends on minimizing log ingestion delays – critical logs should have a lag of less than 60 seconds. Additionally, set up automated alerts to flag high CPU or memory usage, as resource bottlenecks can slow down incident detection. Regular reviews are essential: meet with your SOC team weekly to analyze performance metrics and adjust detection logic based on the latest data. Avoid running your SIEM at more than 80% of its license capacity, as exceeding this threshold can lead to dropped logs during high-stakes security events.
Conclusion
Integrating SIEM with endpoint systems is a continuous process that demands regular updates and improvements. As Lizzie Danielson from Huntress aptly states:
"No project is ever really ‘done.’ Your understanding of the system will continue to evolve. The cyber threats that will be brought to bear against you will continue to evolve. Finally, the technology at your fingertips will continue to evolve. The only way to stay safe is to evolve your SIEM implementation along with them."
Start by focusing on the most critical logs. This includes ingesting Endpoint Detection and Response (EDR) logs, network device logs, and Domain Controller events. Building a strong foundation that ties endpoint events to larger incidents can significantly cut down investigation times.
Don’t overlook the importance of team training. Cyber.gov.au highlights this clearly: "Invest in the training, not just the technology." Your in-house team knows your network better than anyone else, making them key players in identifying subtle threats. Keep them sharp by reviewing incident queues, analyzing threat data, and staying updated on platform changes. These steps will naturally complement the earlier stages of your SIEM implementation.
Make monitoring the health and performance of your SIEM system a routine task. Ensure high-priority data sources are consistently sending logs and that your infrastructure can handle increased log volumes as needed. Regularly auditing alert suppression rules and custom detections can help close potential security gaps.
For organizations aiming for strong SIEM integration alongside secure enterprise-grade hosting, Serverion offers solutions designed to meet today’s security challenges.
FAQs
What steps should I take to ensure my SIEM system works seamlessly with my endpoint security tools?
To make sure your SIEM system works seamlessly with your endpoint security tools, start by checking if your SIEM can handle the log formats and protocols used by the endpoint solution. Confirm that it’s set up to receive logs through supported methods like Syslog, API, or file exports. Also, double-check that network settings, such as IP addresses or DNS configurations, are correctly set up to ensure secure communication.
If you’re using cloud-managed endpoint tools, see if your SIEM supports data ingestion through options like API connections or cloud storage integrations (e.g., AWS S3). It’s a good idea to review the documentation for both systems to verify compatibility, supported protocols, and any specific setup instructions before moving forward with the integration.
What data sources should I focus on for effective log ingestion in a SIEM-Endpoint Security setup?
To make your SIEM-Endpoint Security setup efficient, focus on high-value data sources that offer broad visibility and help spot threats early. Start with endpoint logs, as they track crucial activities like process execution, file modifications, and network connections – often the earliest indicators of malicious behavior. Other must-have logs include those from domain controllers (for monitoring user authentication), network devices (to analyze traffic), and cloud environments (to keep an eye on cloud activity). These sources work together to reveal suspicious patterns across your network.
By concentrating on these critical areas, you can cover more potential attack surfaces without drowning in unnecessary data. Be sure to configure detailed audit policies and use secure methods for log transport to maintain the quality and reliability of the data you collect.
How can I evaluate the performance of my threat detection rules in a SIEM-Endpoint Security setup?
To measure how well your threat detection rules are working, focus on a few key metrics: true positives, false positives, and false negatives.
- True positives represent the threats your system correctly identifies, showing how effectively it catches malicious activity.
- False positives are harmless activities flagged as threats, which can lead to unnecessary alerts and wasted time. Keeping these low improves efficiency.
- False negatives are the threats your system misses entirely, and minimizing these is crucial to avoid potential security breaches.
Regular testing and adjustments are just as important as monitoring these metrics. This means reviewing the quality of alerts, analyzing the outcomes of incidents, and tweaking rule settings to stay ahead of new threats. By combining these practices with ongoing refinements, you can maintain a detection system that’s both accurate and dependable in enterprise settings.


