
How Container Log Aggregation Works
Container log aggregation simplifies collecting and organizing logs from short-lived containers into a single, centralized system. This process is vital because containerized environments generate massive log volumes, and containers often disappear quickly, taking logs with them. Without aggregation, troubleshooting becomes inefficient and fragmented.
Here’s what you need to know:
- Containers log to streams (STDOUT/STDERR), not files. Logs vanish when containers stop unless routed to external systems.
- Managed Kubernetes centralizes logs at the node level. Tools like the kubelet handle log rotation, while paths like
/var/log/pods/store logs temporarily. - Collection methods include node-level agents and sidecars. Node agents (e.g., Fluent Bit) are efficient for cluster-wide logs, while sidecars work for apps with custom log formats.
- Centralized storage ensures persistence. Logs are sent to platforms like Elasticsearch or Loki for querying, analysis, and long-term retention.
Why it matters: Centralizing logs reduces troubleshooting time by enabling structured searches and real-time monitoring. To avoid losing logs, always direct them to standard streams and use reliable infrastructure for storage and transport.
For scalable setups, combine node-level agents with robust storage backends like Kafka or Elasticsearch. This ensures logs remain accessible and organized, even in high-volume environments.
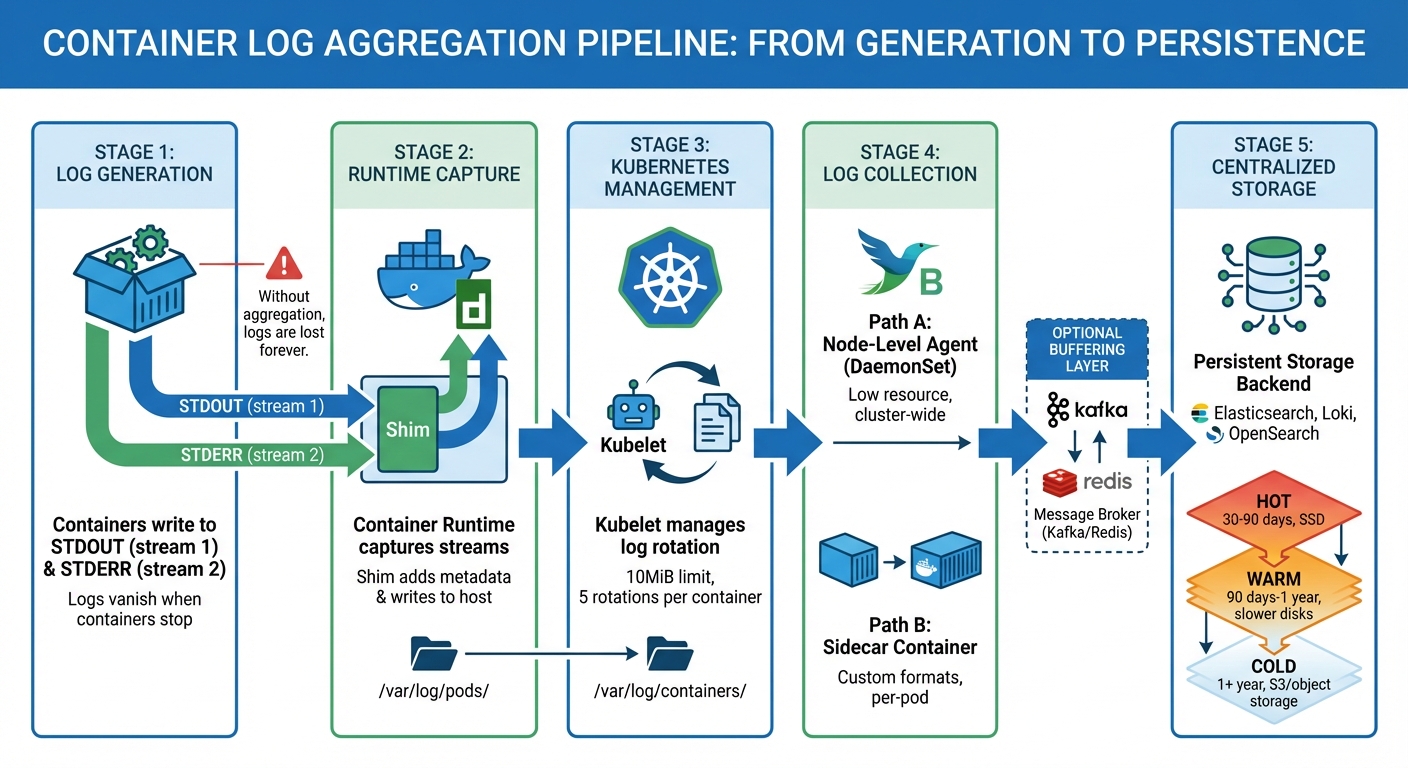
Container Log Aggregation Pipeline: From Generation to Storage
Kubernetes Log Aggregation: Collecting Cluster-Wide Logs | Complete Guide
sbb-itb-59e1987
How Containers Generate Logs
Containers produce logs by using streams rather than saving them as static files. Each process within a container utilizes three I/O streams derived from Unix: STDIN (stream 0) for input, STDOUT (stream 1) for standard output, and STDERR (stream 2) for error messages.
When your application runs, it sends operational data and status updates to STDOUT, while errors, warnings, and diagnostic messages are directed to STDERR. The container runtime – whether it’s Docker, Containerd, or another CRI-compliant tool – captures these streams directly from the containerized process. This is achieved through pipes that redirect the output from the container’s isolated environment to the virtual private server’s host file system.
"The easiest and most adopted logging method for containerized applications is writing to standard output and standard error streams." – Kubernetes Documentation
It’s important not to save logs within the container’s writable layer. Once a container stops or is removed, everything inside – including any log files – disappears. To avoid losing logs, applications must route all logging to STDOUT and STDERR. For older applications that write logs to files, you can create symbolic links to /dev/stdout or /dev/stderr.
Now, let’s explore how these output streams are captured and managed.
Container Log Output Streams
Container runtimes do more than just capture logs – they format and manage them. When Docker or Containerd receives data from STDOUT or STDERR, a component called the Shim processes it. The Shim reads the output, adds metadata, and writes it to host log files. This setup ensures that log data is preserved, even if the container has a short lifespan.
Docker uses logging drivers to determine how and where logs are stored. The default json-file driver saves logs in JSON format on the host’s disk. Each log entry includes the timestamp, the source stream (stdout or stderr), and the log message itself. To prevent performance issues during high-volume output, Docker offers a non-blocking mode. This mode uses a 1MB buffer per container to prevent stalls, though it does mean that some messages might be dropped if the buffer fills up.
| Stream Name | File Descriptor | Purpose |
|---|---|---|
| STDIN | 0 | Input |
| STDOUT | 1 | Standard output |
| STDERR | 2 | Error messages |
Understanding the difference between STDOUT and STDERR is crucial for filtering and alerting. Since STDERR typically highlights errors or warnings, monitoring tools can be configured to send alerts based on this stream, while treating STDOUT as informational. However, applications can run into problems if these streams block due to backpressure. Docker’s non-blocking mode mitigates this issue, though it comes at the cost of potentially losing new log messages.
While container runtimes handle the basics of logging, Kubernetes takes it a step further with node-level management policies.
Kubernetes Log Management
In Kubernetes, the kubelet assumes responsibility for managing logs. It determines where logs are stored on each node and enforces rotation policies to prevent disk space from running out. By default, Kubernetes saves container logs in the following path:
/var/log/pods/{namespace}_{pod-name}_{pod-uid}/{container-name}/{restart-count}.log.
Additionally, it creates symbolic links at /var/log/containers/ for easier access by humans and log collection tools.
Kubernetes rotates logs once they reach 10MiB in size, retaining up to five rotations per container. For example, a pod with three containers will have three separate sets of log files. When you run kubectl logs, the kubelet retrieves these files directly from the node’s storage.
"Shim is responsible for: Reading stdout/stderr output from container processes… Formatting logs… Writing directly to log files." – Addo Zhang, CNCF Ambassador
The integration between the kubelet and container runtime adheres to the Container Runtime Interface (CRI) logging format. This standard ensures that Kubernetes handles logs consistently, regardless of the runtime in use – whether it’s Docker, Containerd, CRI-O, or another option. As of Kubernetes v1.32, a new alpha feature called PodLogsQuerySplitStreams allows you to query STDOUT and STDERR streams separately through the Pod API. This gives you greater control over which log streams you want to access.
These mechanisms ensure that Kubernetes can provide centralized systems with structured, reliable log data.
Log Collection Methods
When containers write logs to a node’s file system, you need a reliable way to gather them across your cluster. There are two main approaches: node-level agents for efficient, cluster-wide log handling, and sidecar containers for application-specific needs. Each method offers distinct advantages based on your setup and requirements.
Node-Level Logging Agents
Using node-level logging agents involves deploying a logging tool on each node via a Kubernetes DaemonSet. This ensures that one agent pod – running tools like Fluentd or Fluent Bit – operates on every worker node. These agents mount directories like /var/log/pods or /var/log/containers, gaining direct access to container logs stored on the host.
"Node level agent, like a Fluentd daemonset. This is the recommended pattern." – AWS Native Observability Guide
The agent continuously monitors log files, enriching them with Kubernetes metadata (e.g., pod name, namespace, container name, and labels) to make the logs easier to search in centralized storage systems like Elasticsearch or OpenSearch. Fluent Bit is a popular choice for this role due to its lightweight design and minimal resource consumption.
To optimize performance, configure the agent to filter logs at the source. Dropping unnecessary logs at the node level reduces both network traffic and storage costs. Set memory buffer limits (e.g., Mem_Buffer_Limit in Fluent Bit) to prevent excessive memory usage during log spikes or backend outages. For large clusters, configure agents to retrieve metadata locally from the kubelet (Use_Kubelet) rather than querying the Kubernetes API server, which helps avoid API rate limits.
| Feature | Node-Level Agent (DaemonSet) | Sidecar Container |
|---|---|---|
| Resource Usage | Low (one agent per node) | High (one agent per pod) |
| App Modification | None required | Requires changes to pod specs |
| Scalability | High | Moderate (adds to pod footprint) |
| Best Use Case | Cluster-wide log handling | Apps with custom log formats |
kubectl logs Support | Fully supported | Not supported for agent-handled logs |
This method provides a scalable and efficient way to collect logs across your cluster without modifying individual applications.
Sidecar Containers for Log Collection
Sidecar containers offer a more tailored approach, especially when applications log directly to files. A sidecar container runs alongside the main application container within the same pod, sharing storage and network namespaces. This setup is ideal for applications that write logs to files instead of STDOUT or STDERR, particularly when dealing with complex formats like Java multi-line logs that node-level agents may struggle to process.
"The sidecar/agent model… is useful when log processing from container logs might not prove to be as efficient as directly reading from an application (E.g., Java multi-line processing)." – Anurag Gupta, Fluent Bit
In this model, the application writes logs to a shared volume (commonly a Kubernetes emptyDir), and the sidecar container tails these logs, forwarding them to a centralized backend. Tools like Fluentd, Fluent Bit, and Filebeat are commonly used as sidecars. Starting with Kubernetes v1.29, native sidecar support allows you to define sidecars as restartable init containers with restartPolicy: Always, ensuring they start before the main container and stop only after it terminates.
While sidecars allow precise log handling, they come with higher resource costs. Each pod runs its own logging agent, which can double storage requirements if the sidecar streams logs to STDOUT. To minimize overhead, use sidecars only for applications that cannot log directly to standard streams, and ensure the sidecar container is as lightweight as possible.
Centralizing and Transporting Logs
After covering log generation and collection, let’s break down how logs are centralized and transported. Once collected, logs need to be stored in a reliable repository that can withstand pod restarts and node failures. This process often involves using a buffering layer to handle sudden traffic spikes and a remote storage system designed for quick querying. Below, we’ll explore how logs are transported and organized for efficient access.
Message Brokers for Log Transport
Using a message broker like Apache Kafka is a common approach to handle log transport. Kafka acts as a buffer between logging agents and storage, ensuring logs aren’t lost during traffic surges. By decoupling log producers from consumers, Kafka allows agents to keep writing logs even if the storage system is temporarily unavailable or overloaded. This setup queues logs safely until the storage system is ready to process them.
For simpler setups, Redis can work as a lightweight queue, though it doesn’t offer the durability Kafka provides. In AWS environments, Kinesis Data Firehose is often a go-to managed service that scales automatically with log volume. When setting up Kafka, it’s important to calculate partitions carefully – divide the total throughput by the lower rate of either the producer or consumer, keeping partitions below 4,000 per broker to maintain performance.
Log Storage Organization
How logs are stored depends largely on the storage system in use. Tools like Elasticsearch and OpenSearch organize logs into time-based indices (e.g., logstash-2026.02.16), which makes querying recent data faster. On the other hand, Grafana Loki uses a more cost-efficient method by indexing only metadata (like namespace, pod name, and container name) while storing log content in compressed object storage.
For long-term log retention, a tiered storage system is often used:
- Hot tier: Logs are stored on high-performance SSDs for 30–90 days, ideal for active troubleshooting.
- Warm tier: Logs move to slower disks for historical analysis, typically retained for 90 days to a year.
- Cold tier: Logs older than a year are archived in object storage, like AWS S3, for compliance or auditing purposes.
When logs are stored in object storage, they’re often partitioned by date and service name. This structure helps optimize queries for tools like Amazon Athena, making it easier to retrieve specific logs when needed.
Analyzing and Accessing Logs
Once logs are centralized, you can use CLI tools for quick troubleshooting or rely on centralized backends for in-depth analysis. Tools like kubectl logs and docker logs are perfect for immediate access, as they directly read local log files by communicating with the container runtime or kubelet. These tools don’t require a centralized backend, making them convenient for real-time checks.
For more advanced analysis, logs are sent to platforms like Elasticsearch, OpenSearch, or Grafana Loki. Each system handles data differently: Elasticsearch uses time-based indices (e.g., logstash-2026.02.16) for full-text search, while Loki focuses on indexing metadata like pod names, namespaces, and labels, storing the actual log content in compressed object storage. This approach makes Loki a cost-effective option for large-scale deployments. As Kubernetes documentation puts it, "In a cluster, logs should have a separate storage and lifecycle independent of nodes, pods, or containers. This concept is called cluster-level logging."
When querying logs, tools like KQL (Kibana Query Language) or SQL-based syntax are commonly used. For instance, searching for errors in a specific namespace might look like this: log.level: "ERROR" AND kubernetes.namespace: "production". On the command line, kubectl logs offers filtering options such as labels (-l app=nginx), time ranges (--since=1h), and even retrieving logs from crashed containers using the --previous flag. While CLI tools are great for immediate needs, centralized systems provide a broader view for historical and trend analysis.
CLI Tools for Log Queries
Command-line tools are indispensable for quick insights, especially when logs are centrally aggregated. The kubectl logs command is widely used, but it comes with limitations. For example, Kubernetes kubelet rotates logs when they reach 10Mi and keeps only 5 files per container. This means if a pod generates 40Mi of logs, you’ll only see the most recent 10Mi using kubectl logs. For system-level issues, Linux nodes running systemd allow you to query kubelet and container runtime logs with the journalctl command.
Here are some useful kubectl logs flags:
--since: Retrieves logs from a specific time frame, such as the last hour (--since=1h).--tail: Limits the output to the last few lines, e.g., the most recent 20 lines (--tail=20).--timestamps: Adds timestamps to each log line, making it easier to analyze timing-related issues.
Aggregation Mode Comparison
Understanding the differences between local log rotation and centralized aggregation is key to choosing the right approach. Local rotation, managed by the kubelet, stores logs on the node’s disk at /var/log/pods. However, these logs are lost when a pod is evicted or a node fails. Centralized aggregation, on the other hand, stores logs in external systems like Elasticsearch or cloud storage, ensuring logs remain accessible even after containers are terminated.
| Feature | Default (Local) Rotation | Centralized Aggregation |
|---|---|---|
| Storage Location | Local node disk (/var/log/pods) | External backend (e.g., Elasticsearch, Cloud Storage) |
| Persistence | Logs deleted after rotation or pod eviction | Retained beyond pod and node lifecycles |
| Accessibility | Access via kubectl logs (latest file only) | Access via Web UI or API (entire history) |
| Search Capability | Basic text streaming/tailing | Advanced queries, indexing, and correlation |
| Resource Impact | Minimal (handled by kubelet) | Higher (requires agents and network bandwidth) |
Centralized logging platforms can significantly reduce the time spent on root cause analysis – by as much as 80%, according to industry data. This efficiency comes from features like advanced query capabilities, multi-service log correlation, and historical data retention. For environments with high log volumes, implementing log sampling at the collection stage can help control storage costs while maintaining essential insights into system performance. This balance between persistence and query capability is critical for effective log management.
How Serverion Supports Log Aggregation
Once you’ve set up log collection and storage strategies, the next step is having the right infrastructure to maintain log integrity – and that’s where Serverion shines. Effective log aggregation needs both persistent storage and high-performance infrastructure, which Serverion’s VPS and dedicated servers are built to provide. Because containers are temporary by nature, their logs vanish when the container stops unless there’s stable host storage to preserve them. Persistent storage is essential for keeping logs intact across container lifecycles, especially when dealing with pod failures or restarts. Serverion tackles this by offering dedicated storage mounted at /var/log/, ensuring your logs survive container restarts, pod evictions, and even node failures.
Dedicated servers stand out for handling log aggregation workloads. Unlike virtualized environments, bare metal servers eliminate the hypervisor layer, making them ideal for resource-heavy logging tasks and processing large amounts of telemetry data. This is especially critical in distributed container setups where log volumes can grow quickly. Additionally, using a node-level logging agent – where one agent collects logs from all containers on a host – reduces CPU and memory strain compared to sidecar-based logging methods.
Serverion’s global data centers add another layer of efficiency to log aggregation. They allow logs to be processed or stored closer to their source, cutting down on network latency and improving real-time monitoring. This distributed approach also helps meet regional regulations, like GDPR or HIPAA, by keeping audit logs within specific jurisdictions. For high-traffic applications, Serverion supports non-blocking log delivery, where logs are buffered in memory (commonly up to 1 MB by default) before processing. This prevents logging operations from slowing down your applications while optimizing performance and compliance.
Another critical advantage of Serverion’s infrastructure is its ability to avoid resource bottlenecks. Logging agents like Filebeat or Fluentd rely on consistent I/O and network bandwidth, particularly during log surges. With dedicated resources, the logging pipeline can handle real-time indexing and search without competing for system resources with your production workloads.
For organizations centralizing their log aggregation efforts, Serverion’s infrastructure covers everything: from deploying DaemonSets to collect logs on every Kubernetes node to hosting storage backends that retain historical data beyond the standard 10 MiB rotation limit. This combination of persistent storage, processing power, and global availability ensures scalable log aggregation. With Serverion, your logs remain accessible and reliable, no matter what happens to individual containers, pods, or nodes.
Conclusion
In containerized environments, log aggregation is essential for maintaining visibility and ensuring smooth operations. Containers, by design, are temporary. When they stop or crash, their logs disappear with them. Without a centralized aggregation system, you’re left with scattered data silos across nodes, making it nearly impossible to diagnose issues in distributed applications. As Karl Kalash, Product Marketing Manager at Chronosphere, explains: "Log aggregation is a fundamental aspect of observability and security. By consolidating logs, you gain complete visibility into the behavior and performance of your systems, applications, and infrastructure."
Centralized logging pipelines aren’t just about convenience – they’re game-changers. Real-world SaaS deployments show that they can cut average incident resolution times from 4 hours to under 40 minutes. That kind of improvement can mean the difference between a minor hiccup and a full-blown outage.
To make this work effectively, treat logs as event streams and route them all to STDOUT and STDERR. Deploy node-level agents to handle the high log volumes efficiently, and use proper log rotation to prevent disk exhaustion. Most importantly, ensure your logs have a lifecycle independent of the containers that generate them. This setup eliminates the need for manual searches across nodes while enabling automated alerts and cross-tier correlations for faster troubleshooting.
For organizations running containerized workloads, the infrastructure supporting your logging strategy is just as critical. Reliable solutions, like Serverion’s VPS and dedicated servers, provide the storage capacity, processing power, and global data center reach needed to handle the demands of log ingestion and retention. Whether you’re managing a small deployment or hundreds of nodes, dependable infrastructure ensures your logs stay accessible and your monitoring systems remain responsive – even during high-pressure production incidents.
FAQs
What log format should my containers output?
Containers should produce logs in a consistent format, like plain text, directed to stdout and stderr. This method follows established best practices for handling log streams, ensuring that logs are simple to collect, centralize, and analyze. Adhering to this approach makes it easier to integrate with log aggregation tools and enhances log management within containerized setups.
When should I use a sidecar instead of a node agent?
When you need per-service isolation and precise control for tasks like logging, monitoring, or security within individual pods, a sidecar is the way to go. Sidecars run alongside the main container in the same pod, boosting its functionality without requiring any changes to the container’s code. This makes them perfect for adding capabilities tailored to specific services.
On the other hand, node agents operate at the node level, handling logs or metrics across multiple pods. While they’re effective for broader tasks, they don’t offer the same level of control or isolation that sidecars provide for individual applications or microservices.
How do I prevent log loss during backend outages?
To avoid losing logs during backend outages, it’s important to have reliable log collection strategies in place. For instance, using local buffering and queuing mechanisms can help temporarily store logs until they can be delivered. Tools designed to buffer logs and retry delivery are especially useful for ensuring logs aren’t lost during unexpected downtime.
It’s also a good idea to centralize logs in a system that’s both scalable and redundant. This ensures logs remain accessible and secure, even if parts of the system fail. On top of that, setting up proper log rotation and storage policies is crucial – this helps manage disk space effectively and prevents overflow, which is particularly important in containerized environments where resources are often limited.


